library(reticulate)
py_install("package_name")Appendix A — Data Wrangling FAQ.
This is an FAQ for James Howison’s Data Wrangling course in the Information School at the University of Texas at Austin. It’s an introductory course that teaches enough python to read csv and wrangle data into mysql, then back out again to conduct some analysis.
Python packages
RStudio doesn’t have the Python packages I need
If you’re running Python in RStudio, you can install additional Python packages directly using the reticulate package.
Replace <package_name> with the name of the package you’d like to install. e.g., pandas.
Getting Data
Convert an html table to csv
http://www.convertcsv.com/html-table-to-csv.htm Careful to select the actual table you want, avoid using the “All” option in the dropdown box. Wikipedia pages sometimes have multiple tables with headers that should be columns (e.g., Season number in https://en.wikipedia.org/wiki/List_of_The_Simpsons_episodes_(seasons_1%E2%80%9320)#Episodes.
You could scrape and parse the HTML but that’s out of scope for this class. You could also save each converted table to a file with the season in the name (e.g., simpsons-season-1.csv) and then combine the tips below on Reading data from filenames and the glob.iglob from Read files in a directory.
Convert a table in a pdf to csv
http://tabula.technology/ or https://pdftables.com/
Read a csv file
There are several ways to read a CSV file, depending on the tool you’re using — Python, R, or Power Query. Below, we’ve included examples for each. If your CSV file doesn’t contain headers, you’ll also find steps in the examples showing how to read csv files in those case.
import pandas as pd

# With headers in the file
df = pd.read_csv('your_file.csv')

# No headers in file, supply your own in a list
headers = ["id", "year", "state_abbr", "gdp_millions"]
df = pd.read_csv('your_file.csv', names=headers, header=None)

# Display the data
print(df.head())

# No headers or uneven rows. Each row a list rather than a dict.
print(df.values.tolist())  # Converts to list of lists

# Or iterate row by row if needed
for index, row in df.iterrows():
    print(row.tolist())  # Each row as a list
# Using base R
data <- read.csv("your_file.csv")
# Using readr package (tidyverse)
library(readr)
data <- read_csv("your_file.csv")
# With custom delimiter
data <- read.csv("your_file.csv", sep = ",", header = TRUE)
# Without headers
data <- read.csv("your_file.csv", header = FALSE)
colnames(data) <- c("id", "year", "state_abbr", "gdp_millions")
See Reading CSV materials.
Handle files with repeated identical headers
The DictReader turns columns into keys of dicts. But we can’t have repeated keys for dicts, so you’ll end up with only one of any set of repeated columns. For example, this file has two “points” columns.
game_city,visiting_team,points,home_team,points
Austin,San Antonio,2,Austin,4
As a human we can tell that one is meant to be the visiting_team_points and one is meant to be the home_team_points but only the order of the columns tells us that.
The simplest option is to edit the headers in the csv, but if you are parsing many files or files received automatically that’s not possible. You can use the same techniques as files without headers (manually declare fieldnames or use csv.reader which returns a list for each row, rather than a dictionary.)
Use a tab separated file
Tab separated files can be parsed with the same code as csv files, but with the delimiter set to “:
import pandas as pd

# Read tab separated file
df = pd.read_csv('Some_tab_separated_file.tsv', sep='\t')

# Display the data
print(df)
# Using base R
data <- read.delim("Some_tab_separated_file.tsv", sep = "\t")
# Alternative with read.table
data <- read.table("Some_tab_separated_file.tsv",
sep = "\t",
header = TRUE)
# Using readr package
library(readr)
data <- read_tsv("Some_tab_separated_file.tsv")
# View the data
head(data)- Open Excel → Data tab → Get Data → From File → From Text/CSV.
- Browse and select your
.tsvfile. - When the preview window opens, click the dropdown next to “Delimiter” and choose Tab.
- You should now see the columns correctly separated.
- Click Transform Data to open the Power Query Editor.
- Make any adjustments (e.g., rename headers, change data types, remove columns).
- Click Close & Load to bring the data into Excel.
Use a fixed width file
A file that uses the number of characters to show where fields separate can be parsed using string slicing on each line.
NAME                STATE     TELEPHONE
John Smith          WA        418-711-4111
Mary Hartford       CA        319-519-4341
Evan Nolan IL 219-532-c301import pandas as pd
# Read fixed width file
# Specify column widths: name (20 chars), state (10 chars), telephone (rest)
df = pd.read_fwf('some_fixed_file.csv',
widths=[20, 10, 50],
names=['name', 'state', 'telephone'])
# Display the data
print(df)# Using read.fwf (fixed width format)
data <- read.fwf("some_fixed_file.csv",
widths = c(20, 10, -1), # -1 means read to end
col.names = c("name", "state", "telephone"),
strip.white = TRUE)
# Using readr package
library(readr)
data <- read_fwf("some_fixed_file.csv",
fwf_widths(c(20, 10, NA),
c("name", "state", "telephone")),
trim_ws = TRUE)
# View the data
head(data)- Open Excel → Data tab → Get Data → From File → From Text/CSV.
- Browse and select your fixed width file.
- When the preview window opens, Power Query will try to auto-detect the format.
- Click on the dropdown next to the delimiter and select Fixed Width.
- Power Query will show vertical lines separating the columns. You can:
- Drag these lines to adjust column boundaries
- Click on the ruler to add new column separators
- Click on existing lines to remove them
- Click Transform Data to open the Power Query Editor.
- Make any adjustments (e.g., rename headers, trim spaces, change data types).
- Click Close & Load to bring the data into Excel.
Inserting data into the database
Drop a column from a csv en route to the database
Just choose not to insert that column by not mentioning it in the INSERT. Let’s say we want to drop the id column here:
id,name,capacity
1,AMD,700
2,Honda,2000
sql_insert = """INSERT INTO my_venues( venue_name, capacity )
VALUES ( %(name)s, %(capacity)s )"""
for row in data:
# doesn't matter that row also has a key "id" because it's not
# called for in the sql_insert, ie there is no %(id)s in the
# values part.
cursor.execute(sql_insert,row)Skip a comment or preamble before the headers in my csv file
Example file:
My great dataset
Copyright 2007, big important person.
name,age,occupation
james,39,professor
heshan,36,dancerimport pandas as pd
# Skip first 2 lines (preamble) and read the rest
df = pd.read_csv('csv_with_preamble.csv', skiprows=2)
# Display the data
print(df)# Using base R - skip first 2 lines
data <- read.csv("csv_with_preamble.csv", skip = 2)
# Using readr package
library(readr)
data <- read_csv("csv_with_preamble.csv", skip = 2)
# If you need more control over which lines to skip
data <- read.csv("csv_with_preamble.csv",
skip = 2,
header = TRUE)
# View the data
head(data)- Open Excel → Data tab → Get Data → From File → From Text/CSV.
- Browse and select your CSV file with preamble.
- When the preview window opens, you’ll see the preamble lines.
- Click Transform Data to open the Power Query Editor.
- In the Power Query Editor:
- Select the rows you want to remove (e.g., first 2 rows with preamble).
- Right-click and select Remove Rows → Remove Top Rows.
- Enter the number of rows to skip (e.g., 2).
- If headers are not promoted automatically:
- Click Use First Row as Headers in the Transform tab.
- Make any other adjustments needed.
- Click Close & Load to bring the data into Excel.
Skip a comment, or other data, in the middle of my csv file
Example file:
name,age,occupation
james,39,professor
#heshan,36,dancer
danielle,21,studentimport pandas as pd
# Read CSV and filter out rows where 'name' starts with '#'
df = pd.read_csv('csv_with_comments.csv')
df = df[~df['name'].str.startswith('#')]
# Display the data
print(df)# Using base R - read and then filter
data <- read.csv("csv_with_comments.csv")
data <- data[!startsWith(data$name, "#"), ]
# Using readr and dplyr
library(readr)
library(dplyr)
data <- read_csv("csv_with_comments.csv") %>%
filter(!startsWith(name, "#"))
# Alternative: specify comment character during read
data <- read.csv("csv_with_comments.csv",
comment.char = "#")
# View the data
head(data)- Open Excel → Data tab → Get Data → From File → From Text/CSV.
- Browse and select your CSV file with comments.
- Click Transform Data to open the Power Query Editor.
- In the Power Query Editor:
- Select the column that contains the comment character (e.g., “name” column).
- Click on the dropdown arrow in the column header.
- Use Text Filters → Does Not Begin With → enter
#. - Alternatively, you can use Remove Rows → Remove Rows → Custom and filter based on conditions.
- Or use the Filter Rows option:
- Home tab → Remove Rows → Remove Alternate Rows or use custom filtering.
- Click Close & Load to bring the cleaned data into Excel.
Handle files with multiple data sections
Some CSV files have multiple data sections, each with a little header. Read these as plain text files and then parse each “minicsv” to treat that section as a file.
For example The US DOJ Universal Crime Reporting Stats does this. If you select more than one state you get data like (with some headers/footers removed):
Estimated crime in Alabama

Year,Population,Violent crime total
2010,4785401,18363
2011,4803689,20166
2012,4822023,21693

Estimated crime in Alaska

Year,Population,Violent crime total
2010,714146,4537
2011,723860,4416
2012,731449,4412

Estimated crime in Arizona

Year,Population,Violent crime total
2010,6413158,26528
2011,6467315,26789
2012,6553255,28108
Each state’s data is repeated in a separate little csv embedded in the larger file.
Eventually we want to create a state column to go along with the others:
State,Year,Population,Violent crime totalTo do this we can split up the file and then read each of as though they were separate CSVs. After the split this ends up very similar to the approach we’d use if these were separate files in a directory.
import pandas as pd
import re
from io import StringIO

# Read the entire file as text
with open("CrimeStatebyState.csv") as file:
    lines = file.readlines()

# Initialize list to store all dataframes
all_data = []
current_section = []
state = ""

# Process line by line
for line in lines:
    if line.startswith("Estimated"):
        # Save previous section if exists
        if current_section and state:
            # Convert section to dataframe with chaining
            section_text = ''.join(current_section)
            df_section = (pd.read_csv(StringIO(section_text))
                         .assign(State=state))
            all_data.append(df_section)

        # Extract new state name
        match = re.search('Estimated crime in (.*)$', line)
        state = match.group(1).strip()
        current_section = []

    elif line.strip():  # Skip empty lines
        current_section.append(line)

# Process the last section
if current_section and state:
    section_text = ''.join(current_section)
    df_section = (pd.read_csv(StringIO(section_text))
                 .assign(State=state))
    all_data.append(df_section)

# Combine all sections into one dataframe
df_final = pd.concat(all_data, ignore_index=True)

# Display the data
print(df_final)library(tidyverse)
# Read the entire file as text
lines <- readLines("CrimeStatebyState.csv")
# Initialize variables
state <- ""
all_data <- tibble()
# Process line by line
current_section <- c()
for (line in lines) {
if (str_detect(line, "^Estimated crime in")) {
# Save previous section if exists
if (length(current_section) > 0 && state != "") {
# Parse the mini-csv
temp_data <- read_csv(paste(current_section, collapse = "\n"),
show_col_types = FALSE)
temp_data <- temp_data %>% mutate(State = state)
all_data <- bind_rows(all_data, temp_data)
}
# Extract new state name
state <- str_extract(line, "(?<=Estimated crime in ).*")
current_section <- c()
} else if (line != "") {
# Add line to current section
current_section <- c(current_section, line)
}
}
# Process the last section
if (length(current_section) > 0 && state != "") {
temp_data <- read_csv(paste(current_section, collapse = "\n"),
show_col_types = FALSE)
temp_data <- temp_data %>% mutate(State = state)
all_data <- bind_rows(all_data, temp_data)
}
# View the result
head(all_data)Power Query doesn’t have a built-in way to handle multiple embedded CSV sections automatically. You’ll need to manually process the file:
Option 1: Pre-process the file
- Before loading into Power Query, use Python or R to split the file into separate CSVs or restructure it into a single table with a State column.
Option 2: Manual transformation in Power Query
- Open Excel → Data tab → Get Data → From File → From Text/CSV.
- Click Transform Data to open the Power Query Editor.
- Use Split Column → By Delimiter or custom M code to identify section headers.
- This approach requires custom M code and can be complex. Example pattern:
- Load as text (not CSV)
- Identify rows with “Estimated crime in”
- Fill down the state name
- Remove section header rows
- Parse remaining rows as CSV
Recommended: Pre-process with Python/R script before loading into Power Query for easier handling.
which outputs:
{'Alabama': 'Year,Population,Violent crime total\n'
            '2010,4785401,18363\n'
            '2011,4803689,20166\n'
            '2012,4822023,21693\n',
 'Alaska': 'Year,Population,Violent crime total\n'
           '2010,714146,4537\n'
           '2011,723860,4416\n'
           '2012,731449,4412\n',
 'Arizona': 'Year,Population,Violent crime total\n'
            '2010,6413158,26528\n'
            '2011,6467315,26789\n'
            '2012,6553255,28108\n'}
Now we’ve built up a dictionary where the keys are state names and the values are the mini-csvs (each as a single long string). Now we can use our familiar csv parsing code to parse each “mini” csv.
Only wrinkle is that our csv is in a string rather than a file but python has a way to treat a string as a file. io.StringIO(somestring) can be used in place of a file.
import pandas as pd
from io import StringIO

# Read and combine all mini-CSVs with chaining
final_df = (pd.concat([
    pd.read_csv(StringIO(state_csv)).assign(State=state)
    for state, state_csv in dict_by_state.items()
], ignore_index=True))

print(final_df)library(tidyverse)
# Assuming dict_by_state is a named list with state names as names
# and CSV strings as values
# Read and combine all mini-CSVs with state information
all_data <- map2_dfr(names(dict_by_state), dict_by_state, function(state, state_csv) {
read_csv(state_csv) %>%
mutate(State = state)
})
# Display the data
print(all_data)Handle multiple headers in columns or cells merged across columns
If your Excel sheet has multiple rows of headers formed by merged cells, save as a csv which will look something like this. You don’t need to unmerge the headers in Excel, just export a csv.
,Agriculture,,,,Industry,,,,Services,,,
,Male,,Female,,Male,,Female,,Male,,Female,
,1990-92,2011-14,1990-92,2011-14,1990-92,2011-14,1990-92,2011-14,1990-92,2011-14,1990-92,2011-14
Afghanistan,..,..,..,..,..,..,..,..,..,..,..,..
See long explanation at Handling Multi Index CSVs.
Handle missing values in rows or cells merged across rows, usually first column
Reuse a value from the last row by not resetting a variable. Some CSV formatted for reading carry values down, usually resulting from vertically merged cells in the first columns (or rowspan in html). e.g.:
rank,country,year,olympic_gold
1,Russia,1980,43
2,Australia,1980,3
,Bahamas,1980,3
4,Thailand,1980,1
See how Bahamas is missing a rank? That’s because the 2 in the line above was applied to both of them with a merged and vertically centered cell. But when you save as csv that goes away and only one row has the value. Thankfully it’s the top row, so we can let the value “fall through”. All we need to do is pull it out of the row into a variable and not reset that variable if row["rank"] is blank.
import pandas as pd

df = pd.read_csv('olympic_data.csv').assign(rank=lambda d: d['rank'].ffill())
print(df)library(tidyverse)
# Read CSV file
df <- read_csv('olympic_data.csv')
# Forward fill missing values in 'rank' column
df <- df %>%
fill(rank, .direction = "down")
# Display the data
print(df)- Open Excel → Data tab → Get Data → From File → From Text/CSV.
- Browse and select your CSV file with merged cells.
- Click Transform Data to open the Power Query Editor.
- Select the column with missing values (e.g., “rank” column).
- Go to Transform tab → Fill → Down.
- This will copy the last non-blank value down to fill the blanks.
- Make any other adjustments needed.
- Click Close & Load to bring the data into Excel.
Handle multiple values inside a cell
Use str.split() to pull them into a list. This happens when a field is actually a list but the user didn’t want to break up the data into relational tables.
student,committee
James,Kevin;Bob;Carsten;Donimport pandas as pd
# Read CSV file
df = pd.read_csv('student_committee.csv')
# Split the committee column and explode into separate rows
df = df.assign(committee=df['committee'].str.split(';')).explode('committee')
# Display the data
print(df)library(tidyverse)
# Read CSV file
df <- read_csv('student_committee.csv')
# Split the committee column and separate into rows
df <- df %>%
separate_rows(committee, sep = ";")
# Display the data
print(df)- Open Excel → Data tab → Get Data → From File → From Text/CSV.
- Browse and select your CSV file.
- Click Transform Data to open the Power Query Editor.
- Select the column with multiple values (e.g., “committee” column).
- Go to Transform tab → Split Column → By Delimiter.
- Choose the delimiter (e.g., semicolon
;). - Select Split into Rows (not columns).
- Click OK.
- Each value will now be in a separate row with the same student name.
- Click Close & Load to bring the data into Excel.
Split a complex field into multiple columns
Use regex to get the separate parts. Regex practice here: https://regexone.com/ and all the documentation you could ever want here: http://www.regular-expressions.info/
import pandas as pd

# Extract season and episode numbers from show_code
df = (
    pd.read_csv('shows.csv')                              # Step 1: Read CSV file into a DataFrame
      .join(                                              # Step 2: Join extracted columns directly
          lambda df_: df_['show_code']
          .str.extract(r'[sS](\d+)[eE](\d+)')             # Step 3: Extract season & episode numbers
          .set_axis(['season', 'episode'], axis=1)        # Step 4: Rename the extracted columns
      )
)

# Step 5: Display the resulting DataFrame
print(df)library(tidyverse)
# Read CSV file
df <- read_csv('shows.csv')
# Extract season and episode from show_code using regex
df <- df %>%
extract(show_code,
into = c("season", "episode"),
regex = "s(\\d+)e(\\d+)",
remove = FALSE)
# Display the data
print(df)- Open Excel → Data tab → Get Data → From File → From Text/CSV.
- Browse and select your CSV file.
- Click Transform Data to open the Power Query Editor.
- Select the column with the complex field (e.g., “show_code” column).
- Go to Transform tab → Extract → Text Between Delimiters.
- For season: Extract text after “s” and before “e”
- For episode: Extract text after “e”
- Or use Split Column → By Delimiter:
- First split by “s” to isolate the season-episode part
- Then split by “e” to separate season and episode
- Rename the new columns to “season” and “episode”.
- Click Close & Load to bring the data into Excel.
Get a zip code out of an address field
business,address,phone
Daisy Chain,"22344 Newfound Road, Austin, 78722, USA",512 345 4456
Use a regex looking for five digits. Can backfire if house number is also five digits so use re.findall() and take last item since zip is at end of address.
import pandas as pd
import re

# Cleanly extract ZIP codes using method chaining
df = (
    pd.read_csv('businesses.csv')             # Step 1: Read CSV file into a DataFrame
      .assign(                                # Step 2: Add or modify columns using .assign()
          zip_code=lambda df_: (              # Create a new column 'zip_code'
              df_['address']
              .str.findall(r'\d{5}')          # Step 3: Find all 5-digit numbers in the address (ZIP-like patterns)
              .str[-1]                        # Step 4: Take the last match from the list (likely the actual ZIP code)
          )
      )
)

# Step 5: Display the cleaned DataFrame with the new zip_code column
print(df)library(tidyverse)
# Read CSV file
df <- read_csv('businesses.csv')
# Extract zip code (last 5 digits in address)
df <- df %>%
mutate(zip_code = str_extract_all(address, "\\d{5}") %>%
map_chr(~tail(.x, 1)))
# Display the data
print(df)- Open Excel → Data tab → Get Data → From File → From Text/CSV.
- Browse and select your CSV file.
- Click Transform Data to open the Power Query Editor.
- Select the “address” column.
- Go to Add Column tab → Custom Column.
- Enter a formula to extract the last 5-digit number:
- Name:
zip_code - Formula: Use M code with Text functions to find the last 5 consecutive digits
- Name:
- Or manually:
- Transform tab → Extract → Last Characters (if zip is always at the end)
- Then clean up to get only the 5 digits
- Click Close & Load to bring the data into Excel.
Note: For complex patterns, consider pre-processing with Python/R before loading into Power Query.
Remove dollar signs and commas from field
Use re.sub or str.replace. Removing them is the same as replacing them with an empty string "". Only trick is remembering that in a regex a literal $ is obtained with \$. You can make a group of characters to match with square brackets and match both the $ sign and any commas. The regex can match anywhere in the string so it can replace all the commas etc.
import pandas as pd

df = (
    pd.read_csv('financial_data.csv')
      .assign(
          money=lambda df_: (
              df_['money']
              .str.replace(r'[\$,]', '', regex=True)
              .pipe(pd.to_numeric, errors='coerce')
          )
      )
)

print(df)library(tidyverse)
# Read CSV file
df <- read_csv('financial_data.csv')
# Remove dollar signs and commas from money column
df <- df %>%
mutate(money = str_remove_all(money, "[$,]"),
money = as.numeric(money))
# Display the data
print(df)-- Using REPLACE function (works in most databases)
SELECT
REPLACE(REPLACE(money, '$', ''), ',', '') AS cleaned_money
FROM financial_data;
-- Convert to numeric after cleaning
SELECT
CAST(REPLACE(REPLACE(money, '$', ''), ',', '') AS DECIMAL(10,2)) AS money_numeric
FROM financial_data;
-- Update existing column
UPDATE financial_data
SET money = REPLACE(REPLACE(money, '$', ''), ',', '');
-- PostgreSQL: Using REGEXP_REPLACE
SELECT
REGEXP_REPLACE(money, '[\$,]', '', 'g') AS cleaned_money
FROM financial_data;- Open Excel → Data tab → Get Data → From File → From Text/CSV.
- Browse and select your CSV file.
- Click Transform Data to open the Power Query Editor.
- Select the column with dollar signs and commas (e.g., “money” column).
- Go to Transform tab → Replace Values.
- In the dialog:
- Value To Find:
$ - Replace With: (leave empty)
- Click OK
- Value To Find:
- Repeat the process for commas:
- Transform tab → Replace Values
- Value To Find:
, - Replace With: (leave empty)
- Click OK
- Change the data type to number:
- Click on the column header icon (ABC/123)
- Select Decimal Number or Whole Number
- Click Close & Load to bring the data into Excel.
Format a field using commas or dollar signs
Can do this either in your database query or in Python/R.
import pandas as pd

# Format numeric values in 'money' column with dollar signs and commas
df = (
    pd.read_csv('financial_data.csv')                   # Read CSV file into a DataFrame
      .assign(                                          # Add a new formatted column
          display_money=lambda df_: (
              df_['money']
              .apply(lambda x: f"${x:,.2f}")            # Format each number as $#,###.##
          )
      )
)

# Display the formatted DataFrame
print(df)
See https://pyformat.info for more info, although it’s missing the comma thing which is documented here: https://www.python.org/dev/peps/pep-0378/
library(tidyverse)
library(scales)

# Read CSV file
df <- read_csv('financial_data.csv')

# Format money column with dollar signs and commas
df <- df %>%
  mutate(display_money = dollar(money))

# Display the data
print(df)
-- FORMAT adds commas and two decimal places, adding .00
-- or truncating to two decimal places.
SELECT FORMAT(your_table.money,2)
FROM your_table
-- Now add a $ in front
SELECT CONCAT('$', FORMAT(your_table.money,2)) as display_money
FROM your_table- Open Excel → Data tab → Get Data → From File → From Text/CSV.
- Browse and select your CSV file.
- Click Transform Data to open the Power Query Editor.
- Select the money column.
- Change the data type to Currency or Decimal Number:
- Click on the column header icon (ABC/123)
- Select Currency for automatic dollar sign and comma formatting
- Or select Decimal Number for just comma formatting
- For custom formatting:
- Add Column tab → Custom Column
- Formula:
"$" & Text.From([money], "en-US")
- Click Close & Load to bring the data into Excel.
- In Excel, you can further format the column:
- Right-click column → Format Cells
- Choose Currency or Accounting format
- Set decimal places to 2
Handle different date formats on the way into the database
Create a python datetime object, pass to parameterized queries. If column is DATE rather than DATETIME time portion will be dropped on insert.
import pandas as pd
from datetime import datetime

# Convert 'start_time' strings to datetime objects
df = (
    pd.read_csv('events.csv')                     # Read CSV file into a DataFrame
      .assign(                                    # Modify or add columns within the same chain
          start_time=lambda df_: (                # Create or replace the 'start_time' column
              pd.to_datetime(df_['start_time'])   # Convert string to datetime objects
          )
      )
)

# Display the final DataFrame
print(df)
Parsing dates with specific formats:
import pandas as pd
# If dates are in a specific format (e.g., "03/30/2013 14:30")
df = (
    pd.read_csv('events.csv')
      .assign(start_time=lambda d: pd.to_datetime(d['start_time'], format='%m/%d/%Y %H:%M'))
)
Handling multiple date formats in the same column:
import pandas as pd, dateutil.parser

df = (
    pd.read_csv('events.csv')
      .assign(start_time=lambda d: d['start_time'].apply(dateutil.parser.parse))
)
Detecting ambiguous dates:
from dateutil import parser

def parse_date(string):
    try:
        # Check if date is ambiguous
        if (parser.parse(string) == parser.parse(string, yearfirst=True) ==
            parser.parse(string, dayfirst=True)):
            return parser.parse(string)
        else:
            print(f"Ambiguous date: {string}")
            return None
    except:
        return None

df = (
    pd.read_csv('events.csv')
      .assign(start_time=lambda d: d['start_time'].apply(parse_date))
)library(tidyverse)
library(lubridate)
# Read CSV file
df <- read_csv('events.csv')
# Convert string dates to datetime objects
df <- df %>%
mutate(start_time = ymd_hms(start_time))
# Display the data
print(df)Parsing dates with specific formats:
# For format "03/30/2013 14:30"
df <- df %>%
  mutate(start_time = mdy_hm(start_time))

# For format "2013-03-30"
df <- df %>%
  mutate(start_time = ymd(start_time))
Handling multiple date formats:
# Parse mixed formats (lubridate tries to guess)
df <- df %>%
  mutate(start_time = parse_date_time(start_time,
                                      orders = c("mdy HM", "ymd", "dmy")))
Common date parsing functions in lubridate: - ymd() - Year, Month, Day (2013-03-30) - mdy() - Month, Day, Year (03/30/2013) - dmy() - Day, Month, Year (30/03/2013) - ymd_hms() - Year, Month, Day, Hour, Minute, Second
- Open Excel → Data tab → Get Data → From File → From Text/CSV.
- Browse and select your CSV file.
- Click Transform Data to open the Power Query Editor.
- Select the date column.
- Power Query will attempt to auto-detect the date format.
- If not detected correctly:
- Click on the column header icon (ABC/123)
- Select Date or Date/Time
- For custom date formats:
- Transform tab → Data Type → Using Locale
- Select the appropriate locale that matches your date format
- Example: “English (United States)” for MM/DD/YYYY format
- Or use Add Column → Custom Column with Date functions:
Date.FromText([date_column], "en-US")for US formatDate.FromText([date_column], "en-GB")for UK format
- Click Close & Load to bring the data into Excel.
Note: Power Query is generally good at detecting date formats automatically. If you have mixed formats in the same column, consider cleaning the data first or using error handling in custom columns.
Record the time I created a record
For SQL use NOW(), for Python use datetime.datetime.now(), for R use Sys.time().
import pandas as pd
from datetime import datetime

df = (
    pd.read_csv('events.csv')
      .assign(log_time=lambda _: datetime.now())   # Add a new column with the current timestamp
)

# Display the data
print(df)library(tidyverse)
library(lubridate)
# Read CSV file
df <- read_csv('log_data.csv')
# Add timestamp column with current time
df <- df %>%
mutate(log_time = now())
# Display the data
print(df)-- Insert with current timestamp
INSERT INTO log_data(message, log_time)
VALUES ('some message', NOW());
-- Using parameterized query (syntax varies by database)
INSERT INTO log_data(message, log_time)
VALUES (?, NOW());
-- PostgreSQL
INSERT INTO log_data(message, log_time)
VALUES ($1, NOW());
-- Create table with automatic timestamp
CREATE TABLE log_data (
id SERIAL PRIMARY KEY,
message TEXT,
log_time TIMESTAMP DEFAULT NOW()
);
-- Then insert without specifying log_time
INSERT INTO log_data(message)
VALUES ('some message');
-- Update with current timestamp
UPDATE log_data
SET log_time = NOW()
WHERE id = 1;- Power Query doesn’t directly support “current timestamp” during data import.
- However, you can add a timestamp column:
- Open Excel → Data tab → Get Data → From File → From Text/CSV.
- Click Transform Data to open the Power Query Editor.
- Go to Add Column tab → Custom Column.
- Enter:
- Column Name:
log_time - Formula:
DateTime.LocalNow()
- Column Name:
- Click OK.
- The timestamp will be set when the query refreshes.
- Click Close & Load to bring the data into Excel.
Note: In Power Query, the timestamp is set when the query runs/refreshes, not when individual rows are created.
Alternative - Add timestamp in Excel: * After loading data to Excel * Add a formula in a new column: =NOW() or =TODAY() * Copy and paste as values to preserve the timestamp
Get data from filenames
Use a regex to pull a field from the filename in a variable. Useful to combine with reading many csvs of same format (glob.iglob).
import pandas as pd
import re

# Example filename
filename = "2008data.csv"

# Extract year from filename using regex
match = re.search(r'(\d+)data\.csv', filename)
year = match.group(1)

# Read CSV file
df = pd.read_csv(filename)

# Add year column from filename
df['year'] = year

# Display the data
print(df)
Reading multiple files with data from filenames:
import glob

# Read all CSV files matching pattern
all_data = []

for filename in glob.glob('*data.csv'):
    # Extract year from filename
    match = re.search(r'(\d+)data\.csv', filename)
    if match:
        year = match.group(1)

        # Read and add year column
        df = pd.read_csv(filename)
        df['year'] = year
        all_data.append(df)

# Combine all dataframes
final_df = pd.concat(all_data, ignore_index=True)
print(final_df)library(tidyverse)
# Example filename
filename <- "2008data.csv"
# Extract year from filename using regex
year <- str_extract(filename, "\\d+")
# Read CSV file
df <- read_csv(filename)
# Add year column from filename
df <- df %>%
mutate(year = year)
# Display the data
print(df)Reading multiple files with data from filenames:
library(fs)

# Get all CSV files matching pattern
files <- dir_ls(glob = "*data.csv")

# Read all files and extract year from filename
all_data <- map_dfr(files, function(file) {
  year <- str_extract(file, "\\d+")

  read_csv(file) %>%
    mutate(year = year)
})

# Display the data
print(all_data)- Power Query can extract data from filenames when loading multiple files from a folder.
- Open Excel → Data tab → Get Data → From File → From Folder.
- Browse and select the folder containing your CSV files.
- Click Combine → Combine & Transform Data.
- In the Power Query Editor, you’ll see a column called Source.Name with filenames.
- Extract data from filename:
- Select the Source.Name column
- Add Column tab → Extract → Text Before Delimiter
- Or use Add Column → Custom Column
- Formula example to extract year:
Text.Middle([Source.Name], 0, 4)(if year is first 4 characters)
- For regex-like extraction:
- Add Column → Custom Column
- Use Text functions to parse the filename
- Example: Extract numbers from “2008data.csv”
- Rename the extracted column to “year”.
- Remove the Source.Name column if not needed.
- Click Close & Load to bring the data into Excel.
Process lots of csv with the same format
Use Path.glob which returns a list of files that you can iterate over. Very useful to combine with getting data from filenames (see above). (Older code uses glob.iglob for same effect.)
import pandas as pd
from pathlib import Path

# Read all CSV files in a directory
all_data = []

for filename in Path('dir_of_files').glob('*.csv'):
    df = pd.read_csv(filename)
    all_data.append(df)

# Combine all dataframes
final_df = pd.concat(all_data, ignore_index=True)

# Display the data
print(final_df)
Alternative with list comprehension:
# More concise approach
all_data = [pd.read_csv(f) for f in Path('dir_of_files').glob('*.csv')]
final_df = pd.concat(all_data, ignore_index=True)
print(final_df)library(tidyverse)
library(fs)
# Read all CSV files in a directory
all_data <- dir_ls("dir_of_files", glob = "*.csv") %>%
map_dfr(read_csv)
# Display the data
print(all_data)Alternative approach:
# Get list of files
files <- list.files("dir_of_files", pattern = "\\.csv$", full.names = TRUE)

# Read and combine all files
all_data <- map_dfr(files, read_csv)

# Display the data
print(all_data)- Open Excel → Data tab → Get Data → From File → From Folder.
- Browse and select the folder containing your CSV files.
- Power Query will show a list of all files in the folder.
- Click Combine → Combine & Transform Data.
- In the dialog:
- Select the sample file to use as a template
- Power Query will automatically apply the same transformation to all CSV files
- Click OK.
- Power Query will load and combine all CSV files with the same structure.
- The combined data will appear in the Power Query Editor.
- Make any additional transformations needed.
- Click Close & Load to bring all the combined data into Excel.
Note: All CSV files should have the same structure (same columns) for automatic combining to work properly.
Combining filename reading and processing a directory
Extract data from filenames while processing multiple CSV files in a directory.
import pandas as pd
from pathlib import Path

# Read all CSV files and extract state from filename
all_data = []

for filename in Path('dir_of_files').glob('*.csv'):
    # Extract state name from filename (without extension)
    state = Path(filename).stem

    # Read CSV file
    df = pd.read_csv(filename)

    # Add state column from filename
    df['state'] = state

    all_data.append(df)

# Combine all dataframes
final_df = pd.concat(all_data, ignore_index=True)

# Display the data
print(final_df)library(tidyverse)
library(fs)
# Read all CSV files and extract state from filename
all_data <- dir_ls("dir_of_files", glob = "*.csv") %>%
map_dfr(function(file) {
# Extract state name from filename (without extension)
state <- path_ext_remove(path_file(file))
# Read CSV and add state column
read_csv(file) %>%
mutate(state = state)
})
# Display the data
print(all_data)Alternative approach:
# Get list of files
files <- list.files("dir_of_files", pattern = "\\.csv$", full.names = TRUE)

# Read and combine with state from filename
all_data <- map_dfr(files, function(file) {
  state <- tools::file_path_sans_ext(basename(file))

  read_csv(file) %>%
    mutate(state = state)
})

print(all_data)- Open Excel → Data tab → Get Data → From File → From Folder.
- Browse and select the folder “dir_of_files” containing your CSV files.
- Click Combine → Combine & Transform Data.
- In the Power Query Editor, you’ll see a column called Source.Name with filenames.
- Extract state from filename:
- The Source.Name column contains the full filename (e.g., “texas.csv”)
- Add Column tab → Custom Column
- Name:
state - Formula:
Text.BeforeDelimiter([Source.Name], ".") - This extracts the filename without the extension
- Or use the Extract feature:
- Select Source.Name column
- Transform tab → Extract → Text Before Delimiter
- Enter
.as the delimiter
- Remove the Source.Name column if not needed.
- Click Close & Load to bring all the combined data into Excel.
Handle files that cause a UnicodeEncodeError character encoding issues
Three things to get to match up: 1) the collation of the database, 2) the encoding used by Python/R to open the file, and 3) the charset of the database connection.
Often the best approach is to open the CSV file in your text editor and save it as UTF-8, then set everything to handle UTF-8.
import pandas as pd

# Read CSV file with UTF-8 encoding
df = pd.read_csv('tricky_file.csv', encoding='utf-8')

# Display the data
print(df)
Handling encoding errors:
# If you encounter encoding errors, try different encodings
# Common encodings: 'utf-8', 'latin-1', 'iso-8859-1', 'cp1252'

# Option 1: Try latin-1 encoding
df = pd.read_csv('tricky_file.csv', encoding='latin-1')

# Option 2: Ignore errors
df = pd.read_csv('tricky_file.csv', encoding='utf-8', errors='ignore')

# Option 3: Replace errors with a placeholder
df = pd.read_csv('tricky_file.csv', encoding='utf-8', errors='replace')

# Option 4: Use surrogateescape (for advanced use)
with open('tricky_file.csv', encoding='utf-8', errors='surrogateescape') as f:
    df = pd.read_csv(f)
For database connections:
import pymysql

# Set charset when creating database connection
connection = pymysql.connect(
    host="localhost",
    user="username",
    password="password",
    database="dbname",
    charset="utf8mb4"  # Use utf8mb4 for full Unicode support
)
See also: - Python text file processing: http://python-notes.curiousefficiency.org/en/latest/python3/text_file_processing.html
library(tidyverse)

# Read CSV file with UTF-8 encoding
df <- read_csv('tricky_file.csv', locale = locale(encoding = "UTF-8"))

# Display the data
print(df)
Handling encoding errors:
# Try different encodings if UTF-8 doesn't work
# Common encodings: "UTF-8", "latin1", "ISO-8859-1", "Windows-1252"

# Option 1: Try latin1 encoding
df <- read_csv('tricky_file.csv', locale = locale(encoding = "latin1"))

# Option 2: Using base R with encoding
df <- read.csv('tricky_file.csv', fileEncoding = "UTF-8")

# Option 3: Detect encoding automatically
library(readr)
guess_encoding('tricky_file.csv')

# Then use the detected encoding
df <- read_csv('tricky_file.csv', locale = locale(encoding = "detected_encoding"))
For database connections:
library(DBI)
library(RMySQL)

# Set charset when creating database connection
con <- dbConnect(
  RMySQL::MySQL(),
  host = "localhost",
  user = "username",
  password = "password",
  dbname = "dbname",
  encoding = "utf8"
)- Power Query usually auto-detects file encoding, but you can specify it manually.
- Open Excel → Data tab → Get Data → From File → From Text/CSV.
- Browse and select your CSV file.
- In the import dialog, click on the File Origin dropdown.
- Select the appropriate encoding:
- 65001: Unicode (UTF-8) - Most common for international characters
- 1252: Western European (Windows) - Common for Western languages
- 28591: Western European (ISO) - ISO-8859-1/Latin-1
- If characters still appear incorrectly:
- Try different encoding options from the dropdown
- Or save the file as UTF-8 in a text editor first
- Click Transform Data to continue with transformations.
- Click Close & Load to bring the data into Excel.
Note: If you’re having persistent encoding issues, the best approach is to: 1. Open the file in a text editor (like Notepad++, VSCode, or Sublime Text) 2. Save it with UTF-8 encoding 3. Then reload it in Power Query
See also: MySQL collations: http://dev.mysql.com/doc/refman/5.0/en/charset-unicode-sets.html
Handle data for multiple years or periods
Sometimes data is gathered for multi-year periods, such as a measurement for sports audience with a year value of 2003-2005. We often face the challenge of comparing this data with data collected for single years, or compare to other periods, such as 2004-2006. Notice that I’m calling this a Period rather than a year. We want to do comparisons per year, so we have to map between Period and Year, and make some estimates.
First we create a Period entity with a name: 2003-2005 becomes Period(id, name) with a row of (1,2003-2005). Then we can map that Period to Year. One way would be to have an attribute for Period of start_year and end_year. Another option might be easier for querying and grouping would be to say Period habtm Year.
Then we have to decide how the data was collected. Two options are common: either it’s a total for that period (how many people attended any game within the period?) or it’s an average for the years in the period (the value represents the yearly attendance over this period).
That suggests a third modeling option: Audience has_many PeriodMeasure. PeriodMeasure has_many Year through YearlyEstimate. Where PeriodMeasure has (id,name,type,value) where type is either “average” or “annual”. YearlyEstimate has (id,period_measure_id,year_id,estimate).
Database queries
My query using OR is returning unexpected rows
In SQL AND has precedence over OR which can lead to strange results. If you are specifying alternative values for one filter it’s simpler to use IN. Rather than
WHERE year = 2004 OR year = 2008 OR year = 2009(which will work but is not preferred) say
WHERE year IN (2004,2008,2009)In addition to being shorter and clearer it is also safer if you have other conditions in your WHERE clause. You might try:
WHERE name = "james" AND year = 2004 OR year = 2006But that will not get records for James from 2004 or 2006. It will get all records from 2006 and just the James records from 2004. That is because AND is resolved before OR. What the server sees is:
WHERE ( name = "james" AND year = 2004 ) OR year = 2006when you meant (and these parens change the order):
WHERE name = "james" AND ( year = 2004 OR year = 2006 )So just say:
WHERE name = "james" AND year IN (2004,2006)This is particularly problematic if you have a join in the WHERE clause because it can create false records.
SELECT *
FROM observations, species
WHERE observations.species_id = species.id AND
  year = 2004 OR year = 2008 OR year = 2009
But that will give unexpected results because the AND pulls the first year to it and leaves the other years on their own. You can see this with parens (this is what the query above actually does):
SELECT *
FROM observations, species
WHERE (
        observations.species_id = species.id
        AND year = 2004
      )
      OR
        year = 2008
      OR
        year = 2009
This includes rows that never existed (because they are generated by the cross-join in the FROM clause but not eliminated by the join condition in the WHERE). What you want would require parens around the OR clause to force it to be resolved first.
SELECT *
FROM observations, species
WHERE observations.species_id = species.id
        AND
      ( year = 2004 OR year = 2008 OR year = 2009 )
But it’s simpler and safer to say:
SELECT *
FROM observations, species
WHERE observations.species_id = species.id
  AND year IN (2004,2008,2009)
Understand three forms of COUNT
The three forms of COUNT are: 1. COUNT(*) counts the number of rows (in a table or in a group). 2. COUNT(DISTINCT column) counts the unique values in a column. 3. COUNT(column) counts the number of non-NULL values in a column.
I often advise people to avoid COUNT(column) because I find the semantics confusing in a query. I mean that what people are intending to get is unclear. More, though, I haven’t come across a time when it is necessary.
Whenever you are tempted to use COUNT(column), especially when using GROUP BY ask yourself whether COUNT(*) is clearer and what you actually mean. Usually when we are grouping we are asking “How many somethings have this value” (e.g., How can performances does a band do? or How many tickets did each person buy?). These are questions about the number of rows, not the number of non-NULL values.
ps. I’m very interested to find an example where COUNT(column) is the ideal thing, so please email me if you see one. Only thing I can think of is something like counting records with relationships. e.g. a table like people(id,name,sig_other)
--How many people have sig others?
SELECT COUNT(sig_other)
FROM people
But I think that would be much clearer as:
SELECT COUNT(*) as sig_other_count
FROM people
WHERE sig_other IS NOT NULL
See: http://dev.mysql.com/doc/refman/5.7/en/group-by-functions.html#function_count and http://www.w3schools.com/sql/sql_func_count.asp
Query a period from a list of start dates
Sometimes we want to match an event up with a period in which it happened. For example, we want to say what phase of the moon a crime occurred in. For the crimes we have a specific date, but for the moon phases we might only have the start date. e.g,
start_datetime,phase
2017-01-05 04:20:00,First Quarter
2017-01-12 01:30:00,Full Moon
2017-01-19 02:51:00,Last Quarter
2017-01-27 10:47:00,New Moon
2017-02-03 12:03:00,First Quarter
How could we query this table to find the phase of the moon for the date 2017-01-22? Looking above we, as humans, can say that it falls between the third and fourth rows, so we can conclude that the moon was in the “Last Quarter” on the 22nd. But how would we do this in sql?
If we had both the start and end dates we could write this as:
SELECT phase
FROM moon_phases
WHERE `2017-01-22` BETWEEN start_datetime AND end_datetime
but we don’t have the end_datetime. Or rather we have the end_datetime but only by reading the table in order. Remember that SQL queries examine each row, returning a TRUE or FALSE value. So we can’t ask queries that are “across rows” meaning we can’t use the start_date of the “next” row as the end_date of the previous row.
We can, though, reframe the question: Can we find the last phase that started before our date of interest?
SELECT phase
FROM moon_phases
WHERE start_datetime < "2017-01-22"
ORDER BY start_datetime DESC -- newest at top
LIMIT 1
Ah, that works.
However that works for individual dates, but it doesn’t lend itself to joins, or for finding the relevant phase for a list of crimes. We could use python to execute this query once for each row in the database, using a parameterized query for each row and storing the result in a “moon_phase” column in the crimes table.
But we can use it in a correlated sub-query, which executes once for each row (unlike a simple sub-query that executes only once).
SELECT *
FROM crimes
  JOIN moon_phases
    ON moon_phases.id = (
        SELECT moon_phases.id
        FROM moon_phases
        WHERE moon_phases.start_datetime <= crimes.crime_datetime
        ORDER BY moon_phases.start_datetime DESC
        LIMIT 1 )
Another possible approach is to add an end_date column to the table. Alter the table to add a new column end_date.
ALTER TABLE moon_phases
    ADD end_datetime DATE;
If the periods have a regular length (e.g., 30 days) this can be much simpler (one could also use DATE_ADD and INTERVAL in a SELECT query directly.)
UPDATE moon_phases
SET end_datetime = DATE_ADD(start_datetime, INTERVAL 30 DAY)
However moon phases aren’t regular in duration (and the general case of periods from an ordered list of dates is interesting):
We can set the end_datetime using python code. First we get the ids of all the periods in order:
sql = """SELECT start_date
         FROM moon_phases
         ORDER BY start_date ASC"""

cursor.execute(sql)

results = cursor.fetchall()  # list of dicts

# make into a simple list of datetimes
just_datetimes = []
for row in results:
    just_datetimes.append(row['start_datetime'])
Now we can offset this list to find the end_dates. We make two lists, the first one is all start_dates, so it is missing the last item. The second list is all end_dates, so it is missing the first item. Then we use the zip function which takes one thing from each list. Here I illustrate just using the days just to type less.
ordered_list = [5, 12, 19, 27, 3]
start_dates = ordered_list[:-1]  # [5, 12, 19, 27]
end_dates = ordered_list[1:]  # [12, 19, 27, 3]
zip(start_dates, end_dates)  # [(5, 12), (12, 19), (19, 27), (27, 3)]
Putting this all together:
sql = """SELECT start_datetime
         FROM moon_phases
         ORDER BY start_datetime ASC"""

cursor.execute(sql)

results = cursor.fetchall()  # list of dicts

# make into a simple list of datetimes
just_datetimes = []
for row in results:
    just_datetimes.append(row['start_datetime'])

update_sql = """UPDATE moon_phases
                SET end_datetime = %(end_datetime)s
                WHERE start_datetime = %(start_datetime)s
             """

start_dates = just_datetimes[:-1]
end_dates = just_datetimes[1:]

for start_date, end_date in zip(start_dates, end_dates):
    # subtract 1 second from end_date to avoid overlap
    end_date = end_date - datetime.timedelta(seconds=1)
    param_dict = {"start_datetime": start_date,
                  "end_datetime": end_date}
    cursor.execute(update_sql, param_dict)
Note that this leaves the final period without an end_datetime. That is unavoidable because that data is not in the database.
The correlated sub-query solution is better in that respect because it would put events in the last period.
Interacting with the database from python
Reading many rows from database without bringing them into memory
cursor.fetchall() is useful but returns all the results into memory in Python. Avoid this with large queries as you might hit errors like pymysql.err.OperationalError: (2013, 'Lost connection to MySQL server during query. Instead you can use cursor directly as an iterator.
sql = "SELECT * FROM venues" # SQL queries are just a string.
cursor.execute(sql)
#results = cursor.fetchall() don't include this line

csv_column_order = ['id','name','capacity'] # manually
# csv_column_order = [i[0] for i in cursor.description] # automatically
with open('exported-venues.csv', 'w') as csvfile:
  myCsvWriter = csv.DictWriter(csvfile, fieldnames = csv_column_order)
  myCsvWriter.writeheader()
  for row in cursor: # rather than 'for row in results'
    myCsvWriter.writerow(row)
Get columns names in order while using DictReader
DictReader is convenient but we lose the order of the columns as returned by the database server. The cursor has this information, but it is a little hidden. You can get them in a list (thus preserving order) using this code:
column_names = [i[0] for i in cursor.description]Insert multiple rows into the database based on values in different columns in a single row (aka pivot longer)
Use an inner for loop over the columns within a row. e.g., a CSV about Gold Medals
country,1984,1988,1992
Australia,32,33,34
USA,60,23,34
for row in myCSVReader:
country = row["country"] # some item that applies to all.
for key,value in row.items(): # row is a dict : { "1984": 32, "1988"}
if (key == "country"):
continue # skip this item.
param_dict = { "country": country,
"year": key,
"gold_medals": value}
cursor.execute(sql_insert,param_dict)Afterwards these data would be represented in a “long” format:
id, country, year, gold_medals
1, Australia, 1984, 32
2, Australia, 1988, 33
3, Australia, 1992, 34
4, USA,       1984, 60
5, USA,       1988, 23
6, USA,       1992, 34
See Data Transforms and the School Absences homework (which is similar, except iterating over a string in the row rather than the row items).
Handle names with different forms
In the database, create an entity for the thing and an entity for the names. e.g., Person has_many PersonName, PersonName belongs_to Person. or Country has_many CountryName, CountryName belongs_to Country. Use that data to create a dictionary that enables quick conversion from any form of the name to either a standard name or the person/country id.
us_names = ["usa","United States of America", "US"]
countryMap = { "usa": "usa",
               "United States of America": "usa",
               "US": "usa" }
for alt_name in us_names:
  print("Even given {}".format(alt_name))
  #map alt_name to "usa" by using it as a key to the dictionary
  print("We can get {}".format(countryMap[alt_name]))
See code and database schema at Miscellaneous Tips
Handle state names and abbreviations
State names and abbreviations are examples of different forms of names. See above for general approach, but for US states specifically there is really useful data available. This used to be on a website called statetable but I’ve cached a copy here from data.world: https://data.world/markmarkoh/us-state-table
| id | name | abbreviation | fips_state | assoc_press | standard_federal_region | census_region | census_region_name | census_division | census_division_name | circuit_court |
|---|---|---|---|---|---|---|---|---|---|---|
| 1 | Alabama | AL | 1 | Ala. | IV | 3 | South | 6 | East South Central | 11 |
| 2 | Alaska | AK | 2 | Alaska | X | 4 | West | 9 | Pacific | 9 |
| 3 | Arizona | AZ | 4 | Ariz. | IX | 4 | West | 8 | Mountain | 9 |
This includes abbreviations and useful stuff like which region of the country a state is in, which allows you to do you analyses via region which can be easier to understand that by state.
Avoid inserting duplicate records
Use three sql queries: a SELECT an UPDATE and an INSERT. SELECT to see if a record already exists, if it does then an UPDATE (or nothing), if it doesn’t then a SELECT.
sql_select = "SELECT id from venues WHERE name = %(venue_name)s"
sql_update = "UPDATE venues SET capacity = %(capacity)s WHERE id = %(found_id)s"
sql_insert = """ INSERT INTO venues(name,capacity)
                      VALUE (%(venue_name)s,%(capacity)s)
                 RETURNING id"""
param_dict = { "name": "AMD",
               "capacity": 2000 }
cursor.execute(sql_select,param_dict)

if (cursor.rowcount == 0): # none found by SELECT
  cursor.execute(sql_insert,param_dict)
  venue_id = cursor.fetchone()['id'] # from INSERT ... RETURNING id
else:
  venue_id = cursor.fetchone()['id'] # from select
  # update if additional fields are being added.
  param_dict["id"] = venue_id
  cursor.execute(sql_update,param_dict)
See also class notes on (CSV to SQL via Python)[http://howisonlab.github.io/datawrangling/class_modules/12_csv_to_sql_via_python/#find-or-create-an-id-csv-contains-mix-of-data-about-new-and-existing-entities]
Lookup foreign keys while inserting data
tl;dw Use the “find or create” sequence.
Ultimately we want to insert into the performances table, but to do that we need the band_id and the venue_id. However, we don’t yet have those. Instead we have the venue_name and the band_name. So we have to convert those to ids. We convert those by first checking if they are already in the database (using a SELECT). If they are, then we have the id. If they aren’t then we use an INSERT to create the row, and get the id that way. Either way, we end up with the id we need and can use those in the insert into performances.
sql_insert_performance = """INSERT INTO performances(start,band_id,venue_id)
                VALUE (%(band_id)s, %(venue_id)s, %(start_time)s)"""

sql_select_venue = "SELECT id from venues WHERE name = %(venue_name)s"
sql_select_band_name = "SELECT id from bands WHERE name = %(band_name)s"

sql_insert_venue = "INSERT INTO venues(name) VALUE (%(venue_name)s"
sql_insert_band_name = "INSERT INTO bands(name) VALUE (%(band_name)s"


# data normally would come from a CSV
incoming_data = [ { "band_name": "Cut Copy",
                    "venue_name": "AMD",
                    "start_time": "2016-03-12 18:00:00"} ]

for row in incoming_data:
  # find or create venue
  cursor.execute(sql_select_venue, row)
  results = cursor.fetchall()

  if (len(results) == 0):
    cursor.execute(sql_insert_venue, row)
    venue_id = cursor.lastrowid # get id of newly created venue.
  else:
    venue_id = results[0]["id"] # get found id.

  # find or create band
  cursor.execute(sql_select_band, row)
  results = cursor.fetchall()
  if (len(results) == 0):
    cursor.execute(sql_insert_band, row)
    band_id = cursor.lastrowid # get id of newly created venue.
  else:
    band_id = results[0]["id"] # get found id.

  # add ids to param_dict
  param_dict = {"band_id" = band_id,
                "venue_id" = venue_id,
                "start_time" = row["start_time"]}

  cursor.execute(sql_insert_performance, param_dict)
You might think it worthwhile to create a reuseable find_or_create function, but it is very tricky to do that in general, it is almost worthwhile to do a find_or_create function for each table if you always do lookups by a specific column. Honestly, though, by the time that is worthwhile you should consider using an Object-Relational Mapping library, such as SQLAlchemy.
See CSV to SQL via Python materials.
Join database tables without foreign keys
Foreign keys are a convenience but not required for joining tables, any field with matching values will work. e.g.,
-- state_gdp(state_abbr,gdp)
-- state_weather(state_abbr,weather)
SELECT *
FROM state_gdp, state_weather
WHERE state_gdp.state_abbr = state_weather.state_abbr
or
-- addresses(id,business_name,address,zip)
-- incomes(id,zip,avg_income)
SELECT *
FROM addresses, incomes
WHERE addresses.zip = incomes.zip

-- Now count the businesses in each zip and the income
SELECT zip, COUNT(*) as num_businesses_in_zip, avg_income as avg_income_in_zip
FROM addresses, incomes
WHERE addresses.zip = incomes.zip
GROUP BY zip
So you don’t need to create primary key/foreign key relationships although they are very useful and required if there are related objects with no field to match by.
Speed up mysql queries-avoiding Lost connection to MySQL server during query error
Ensure you have defined indexes on the columns you use in your joins. The server has a guard to ensure that queries don’t block up the server for others. That guard kills long-running queries. Indexes make it much easier for mysql to do the joins. You can define these through phpmyadmin using the Index icon to the right of the column row on the structure tab (it might be hidden under the “More” button if you don’t have enough wide on your screen).
You can tell if your indexes are being used by adding EXPLAIN to the front of your query (check the possible_key and key output, you want to see something there). See more here: https://www.sitepoint.com/using-explain-to-write-better-mysql-queries/ and http://dev.mysql.com/doc/refman/5.7/en/using-explain.html
So why not just add indexes to everything? They take up space and have to be updated for each insert so there are many trade offs.
Speed up mysql inserts
Help, it takes ages for my data to insert! See Importing large files
First try is turning off autocommit:
# Before first execute.
cursor.execute("SET autocommit = 0")
for row in myCSVReader:
  cursor.execute(sql, row)

#All execute done.
cursor.execute("COMMIT")
Second try, for very large files, is using python to create a csv that exactly matches the database table (name of file and names of headers) and mysqlimport from the terminal (not via python). This will ask for your mysql password before doing the insert.
mysqlimport -u testuser -p --local --fields-terminated-by=',' \
           --fields-enclosed-by='"' --ignore-lines=1 \
           testuser_empty_music_festival ./tickets.csv
btw, don’t even think about using phpmyadmin for this, the web interface does not work with uploading large files.
Addresses and GIS
Get the distance between two addresses
This requires using external libraries, either Maps or GIS. I show an example using Open Street Map. See files below (documentation in the .py file)
Analysis
Complex analyses are beyond the scope of this course, but here are just a few simple things that might be useful.
Assess correlation between two variables
The SciPy and Numpy modules offer many stats functions. Here’s correlation, you need to provide two lists of equal length to compare. These will likely be columns from your database query. https://docs.scipy.org/doc/scipy-0.14.0/reference/generated/scipy.stats.pearsonr.html
import scipy.stats
# extract two columns from your query.
crimes = []
gdp = []
for row in results:
  crimes.append(row["crime"])
  gdp.append(row["gdp"])

# pearsonr and spearmanr return correlation and confidence interval. Get just the correlation using [0]
# pearsonr uses magnitude
print(scipy.stats.pearsonr(crimes,gdp)[0])
# spearmanr uses just rank
print(scipy.stats.spearmanr(crimes,gdp)[0])
Note that easier access to columns etc can be obtained through the pandas module, but that’s beyond the scope of this course.
── Attaching core tidyverse packages ──────────────────────── tidyverse 2.0.0 ──
✔ dplyr 1.1.4 ✔ readr 2.1.5
✔ forcats 1.0.0 ✔ stringr 1.5.1
✔ ggplot2 3.5.2 ✔ tibble 3.3.0
✔ lubridate 1.9.4 ✔ tidyr 1.3.1
✔ purrr 1.1.0
── Conflicts ────────────────────────────────────────── tidyverse_conflicts() ──
✖ dplyr::filter() masks stats::filter()
✖ dplyr::lag() masks stats::lag()
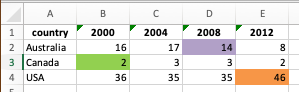
ℹ Use the conflicted package (<http://conflicted.r-lib.org/>) to force all conflicts to become errorsRead colors from Excel files
Colored backgrounds are often used in Excel manual data entry to indicate things like status. They are tricky because they are not passed to textual formats like csv. It is even tricky for Excel itself to turn the color metadata about a cell into data in cells (it requires formula that not all versions of Excel have, or an older scripting language called VBA).
We can, though, get this done in both R and Python. For SQL based workflows we would need to look beyond SQL; so the R and Python based solutions would probably be used within a dbt or other ETL pipeline.
Here is an example Excel file with coloring applied. We will read this, convert to a long format, and add a column showing the color of the cell.
library(writexl)
library(GmooG)
data(OlympicPerfs)
reduced_data <- OlympicPerfs |>
  filter(medalType == "GOLD") |>
  group_by(games, country, medalType) |>
  summarize(medal_count = n()) |>
  ungroup() |>
  filter(country %in% c("Australia", "United States of America", "Canada"),
         games |> str_detect("2000|2004|2008|2012")) |>
  separate_wider_delim(games, delim = "-", names = c("host", "year")) |>
  select(!c(medalType, host)) |>
  mutate(country = case_match(country,
                        "United States of America" ~ "USA",
                        .default = country),
         year = as.numeric(year)) |>
  pivot_wider(names_from = year, values_from = medal_count) |>
  select(country, `2000`, `2004`, `2008`, `2012`)
`summarise()` has grouped output by 'games', 'country'. You can override using
the `.groups` argument.# #| eval: false
#
# library(openxlsx)
# library(dplyr)
#
#
# file_path = "faq_assets/olympic_excel_to_color.xlsx"
# sheet = 1
#
# read_excel_with_colors <- function(file_path, sheet = 1) {
# # Load workbook
# wb <- loadWorkbook(file_path)
#
# # Read the data
# data <- read.xlsx(file_path, sheet = sheet)
#
# # Create a matrix to store colors
# colors <- matrix(NA,
# nrow = nrow(data),
# ncol = ncol(data),
# dimnames = list(NULL, names(data)))
#
# # Get sheet index
# if(is.numeric(sheet)) {
# sheet_idx <- sheet
# } else {
# sheet_idx <- match(sheet, names(wb))
# }
#
# # Get fill colors for each cell
# for(row in 1:nrow(data)) {
# for(col in 1:ncol(data)) {
# style <- wb$worksheets[[sheet_idx]]$sheet_data$cellStyles[row + 1, col]
# if(!is.null(style)) {
# fill <- style$fill
# if(!is.null(fill)) {
# colors[row, col] <- fill
# }
# }
# }
# }
#
# # Convert colors matrix to data frame
# colors_df <- as.data.frame(colors)
# names(colors_df) <- names(data)
#
# # Return both data and colors
# return(list(
# data = data,
# colors = colors_df
# ))
# }
# Example usage:
# First ensure you have both required packages:
# install.packages(c("xlsx", "rJava"))
#
# Then use the function:
# result <- read_excel_with_colors("your_file.xlsx")
#
# View results:
# head(result$data)
# head(result$colors)
# Example usage:
# First install the xlsx package if you haven't:
# install.packages("xlsx")
#
# Then use the function:
# result <- read_excel_with_colors("your_file.xlsx")
#
# View results:
# head(result$data)
# head(result$colors)
# Test the function with a small example:
# file_path <- "test.xlsx"
# result <- read_excel_with_colors(file_path)
#
# # View the first few rows of both data frames
# head(result$data)
# head(result$colors)
# Example usage:
# file_path <- "your_excel_file.xlsx"
# result <- read_excel_with_colors(file_path)
#
# # Look at the data
# print(head(result$data))
#
# # Look at the colors
# print(head(result$colors))
#
# # To see which cells have a specific color (e.g., red FF0000)
# color_mask <- result$colors == "FF0000"
# colored_cells <- result$data[color_mask]
# Example usage:
# file_path <- "your_excel_file.xlsx"
# result <- read_excel_with_colors(file_path)
#
# # View the data
# head(result$data)
#
# # View the colors
# head(result$colors)
#
# # Combine data with colors for a specific column
# data_with_colors <- cbind(
# result$data,
# color = result$colors[, 1] # Replace 1 with your column number
# )# df <- read_excel_with_colors("faq_assets/olympic_excel_to_color.xlsx")
# Example usage:
# file_path <- "your_excel_file.xlsx"
# result <- read_excel_with_colors(file_path)
#
# # Access the data
# data <- result$data
#
# # Access the colors
# colors <- result$colors
#
# # Combine data with colors for a specific column
# combined <- data %>%
# mutate(column_colors = colors$column_name)
#
# # Filter rows based on color
# red_rows <- data[colors$column_name == "FF0000", ]Read multiple files with similar formats, getting data from file names
Quite often we have data split up across multiple files. For example we might have these files:
medals_2010.csv
medals_2011.csv
medals_2012.csv
but each have the same format inside, e.g.,
event,medal,countryNotice that the filename has data in it, each file has the year. So eventually we would like to have
year,event,medal,countryWe can accomplish this within a dataframe by using an apply (called map in Tidyverse) and an unnest. We use these steps:
- We start with a dataframe with a column that contains the filenames and the years
- We use each row as parameters to a function (this is very much like iterating over the rows in the table); here the function reads the whole csv into a single cell. This move is can be called
applybut in Tidyverse it is calledmap. - We
unnestthe cell containing the CSV, which places each row in the nested CSV alongside copies of theyearcolumn. This is like unnesting a list of comma separated course names, but instead of a single item, the nested items are rows.
# first write out the files
tribble(
  ~event,~medal,~country,
  "100m", "gold", "Bahamas",
  "100m", "silver", "Jamacia"
) |> write_csv('medals_2010.csv')

tribble(
  ~event,~medal,~country,
  "100m", "gold", "USA",
  "100m", "silver", "Dominica"
) |> write_csv('medals_2011.csv')

tribble(
  ~event,~medal,~country,
  "100m", "gold", "Bahamas",
  "100m", "silver", "USA"
) |> write_csv('medals_2012.csv')
Now that we have the files we will start with the filenames in a dataframe.
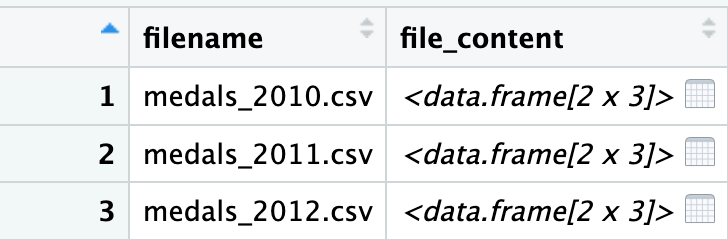
names_and_filecontent <- tribble(~filename,
  "medals_2010.csv",
  "medals_2011.csv",
  "medals_2012.csv"
) |>
  mutate(file_content = map(filename, read_csv, show_col_types = FALSE))

names_and_filecontent
We now have a new column file_content; this has the type list and the items within it are tbl_df which means they are dataframes. If we double click or use View() in Rstudio we can see a little more clearly:
If we double click one of the cells on the right, we zoom in and see the full csv contained within:
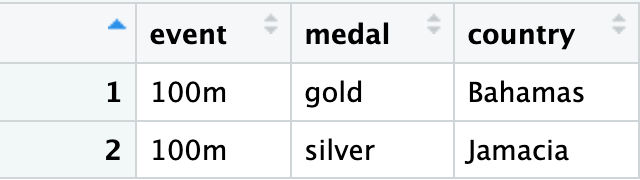
Now we can use unnest to bring these all out to a familiar dataframe.
names_and_filecontent |>
  unnest(cols = file_content)
So the filename column is repeated for each of the rows that used to be in the file_content column, which means that we know the origin of each row. We can now get our year from our filename using an extract and a regex that matches “the actual characters 2 and 0, followed by any two characters, followed by .csv
names_and_filecontent |>
  unnest(cols = file_content) |>
  mutate(year = str_extract(filename, "20\\d\\d")) |>
  select(year, event, medal, country)
Vizualize correlations between three variables
Imagine a project where you have three variables, for example:country_population, country_gdp, and country_latitude (distance from equator).
It’s straightforward to visualize correlation between any two of these: you can use a scatterplot with the vertical axis being one variable, and the horizontal axis being a second variable. But how can you get the third variable represented there as well?
You can use the values in the third variable to change the dots in some way, changing their color or their size is the usual approach. You can then experiment with different combinations, such as population and gpp on the axis, or latitude shown by color, or swap the latitude onto the vertical axis and use the size of a point to show the population.
There are good examples in R tidyverse and Python here https://sscc.wisc.edu/sscc/pubs/DWE/book/3-4-sect-ggplot-multiple-var.html
Quarto tips
Ensuring images are not missing from html exports
html usually has images just in an <img> tag which points to separate image files.
But when you want to create just a single file that you can submit to the assignment you can’t provide the image files separately.
One approach to this is that the image files get “base64 encoded” as text within the HTML file.
Use this in the YAML header for the quarto file:
```{yaml}
format:
  html:
    embed-resources: true
    # self-contained: true <-- older but same result
```
See more quarto html export tips at the quarto documentation.
Tabsets
Since we are working across four frameworks it can be convenient to be able to show four versions of the same data operation. In quarto we can do this with tabsets (just as we’ve done on this page). The documentation on how to do this is at https://quarto.org/docs/output-formats/html-basics.html#tabsets
Why don’t you teach …
What is a list comprehension and why is it not taught
Python offers a syntax to simplify a common idiom:
# Pull all "some_key" out of the list of dicts
new_list = []
for item_dict in myListOfDicts:
  value_for_key = item_dict["some_key"]
  new_list.append(value_for_key)
Could be written as:
new_list = [ item_dict["some_key"] for item_dict in myListOfDicts ]That’s called a List Comprehension, see more here http://www.pythonforbeginners.com/basics/list-comprehensions-in-python. I don’t teach it in the course because a) I grew up on other languages, and b) I find it confusing to follow the step by step logic. Anyway, it’s a useful thing to know about.
Why don’t you teach the JOIN keyword (aka ANSI JOINs, aka explicit joins)
In the course we learn joins that look like this:
SELECT *
FROM person, tickets
WHERE person.id = tickets.person_id
Another way of writing that is:
SELECT *
FROM person JOIN tickets
  ON person.id = tickets.person_id
The first way is variously called “implicit join”, “old-style join” and the second way is variously called “explicit join”, “ANSI style join”. You may even here the first way called “the awful, broken, don’t ever do it way” or the “wrong way” and the new style the “right way”. See http://www.sqlservercentral.com/blogs/brian_kelley/2009/09/30/the-old-inner-join-syntax-vs-the-new-inner-join-syntax/
I teach the “old-style” or “implicit” notation because I explain joins as a logical extension to filtering data using the WHERE clause: joins, regardless of syntax, can be conceptually understood as row-by-row filters on a cross-product (regardless of whether they are implemented that way).
The downsides are well known:
- The server gets slammed by cross-products without joining expressions in the
WHEREclause, - Unexpected rows when using
ORin combination with “implicit” joins. See My query using OR is returning unexpected rows - Difficult extension to other types of joins, particularly
OUTERjoins. This difficult extension toOUTERjoin bothers me, as they do come up in projects, and I may change my approach.
Why do you not teach proper Entity-Relationship diagrams
There are many notations for Data Modeling. Wikipedia has a great description of the options and examples of different notations.
I use a slightly modified version of Unified Modeling Language (UML) class diagrams. I use this because:
- I think it’s simpler :)
- I learned it (I also learned “crow’s foot” notation)
- It maps well onto Object-Relational Models (ORM) frameworks.
- It provides a scaffold onto further UML modeling for object-oriented programming.
The most similar to my presentation is in Clare Churcher’s very accessible and inexpensive book “Beginning database design: from novice to professional” Amazon link, UT libraries catalog link
Churcher uses UML in much the same way I do (although she uses n for “many” where I use *) and labels the line only in one direction. I find labeling it in both directions (which is used in one of the ISO data modeling notations) helps with reading the diagram out loud (and remembering which set of cardinality numbers go with which direction).
Churcher does talk about modeling what I call “has_many through” but she calls that an “intermediate table” for “many-to-many” with attributes.
Churcher uses a different set of conventions for naming tables and attributes (I use the ActiveRecord conventions popularized by Ruby on Rails), but everything in Churcher’s book should be familiar enough.
Where does this “has_many”, “belongs_to” Relational Vocabulary come from?
The relational vocabulary that I teach comes from the ActiveRecord Object Relational Mapping framework, made famous by Ruby on Rails.
The conventions about tables being pluralized and id and foreign_id also come from ActiveRecord.
I find it a convenient way to teach a set of conventions to encourage consistency.
I also hope it is a useful scaffold for students going forward towards web development.