Appendix C — Handling multiple header rows.
Many data files come with multiple header rows. These are visually useful but can be confusing to understand and to parse for data analysis. The key things to understand are:
- The multiple headers apply to groups of fields in the data part of the file.
- The headers are actually a type of data (they are similar to the example in year_posts.py)
For example, see a screenshot of this file, taken from a World Bank dataset on employment by gender in different sectors in different countries. The data helps us understand where people work in the economy in different countries and allows us to compare differences across gender and over time. There are actually four rows of headers here (Rows 1 through 4).
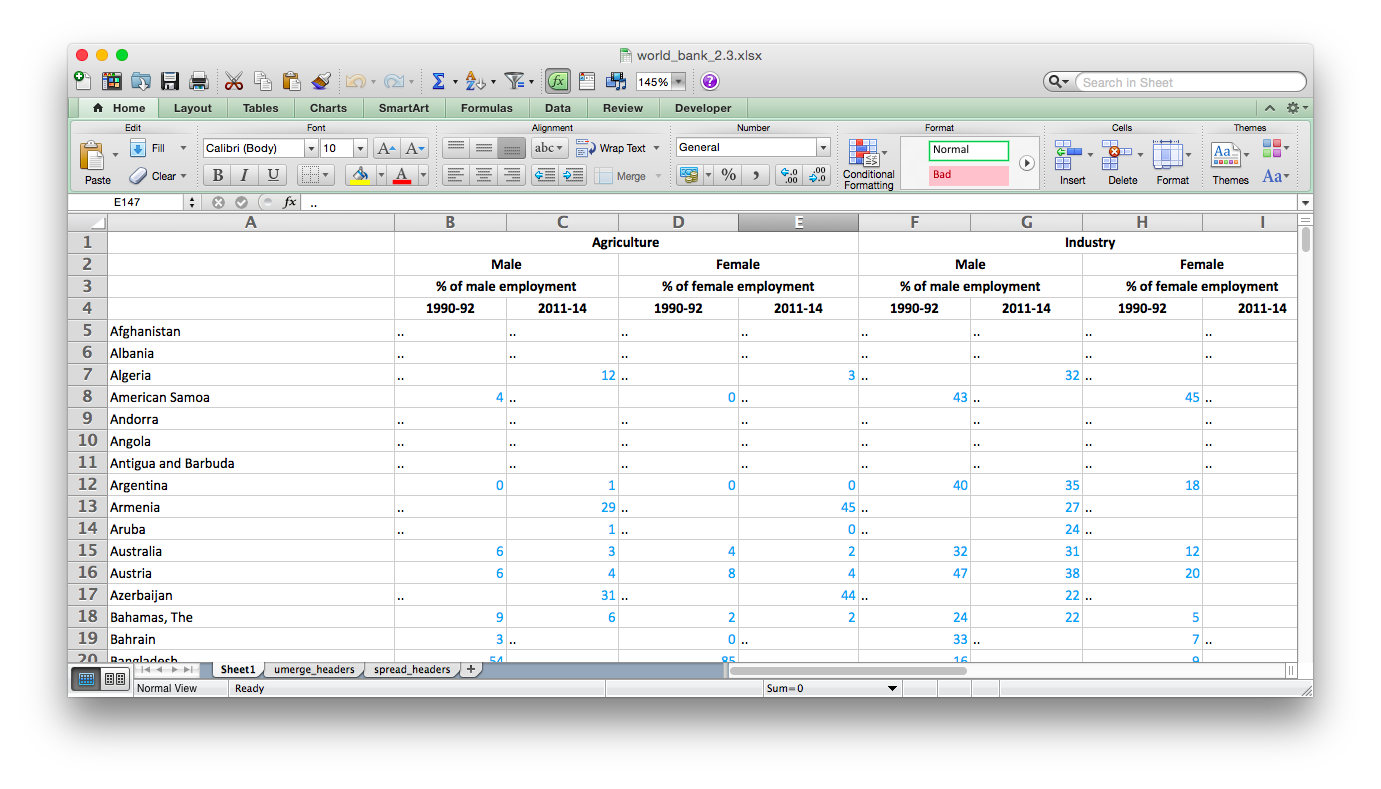
As literate people we know how these tables work. We can look at a field in the data part and understand what is being measured. For example cell C7 shows the number 4. We can read over to the first column and find the Country (“Algeria”). We can read up and see that this value is for the period “2011-14”. We can read up again (to row 3) and see that this value is “% of male employment” and up again (to row 2) and see that this is for “Male” people from Algeria. Finally we can read up again (to row 1) and see that this is for the sector “Agriculture”. Note that row 3 repeats the gender data from row 2, but otherwise just tells us what is being measured (percent employment). Putting that all together we can say “4% of the men in Algeria worked in Agriculture in the period 2011-14”. Similarly we can read cell D16 as “8% of the women in Australia worked in Agriculture in the period 1990-92”.
How could we arrange this data without multiple header rows, into our more familiar rectangular datasets? Here is one option:
country,sector,gender,period,employment_percent
Algeria,Agriculture,Male,2011-14,4
Australia,Agriculture,Female,1990-92,8
This structure retains all of the data but only has a single row of headers. Certainly this format is harder to read for people, but it is easier to work with on the computer. Footnote: It isn’t impossible to work with multiple headers directly, but it is somewhat confusing. The Python package pandas handles multiple header rows like this directly using their MultiIndex/Advanced Indexing feature.
Note that the file uses “..” to indicate missing data (and there is quite a lot of it.) We could either simply not include rows where there isn’t data, or we could acknowledge that we tried to find data but couldn’t by inserting a row with a value that indicates missing data. A common one to use is the string “NA”. So you could have a row for the missing data of
Afghanistan,Agriculture,Female,1990-92,NAOk, so now we know how to read our file and how we’d like our output to be. So how do we get from one to the other? The screenshot below shows our data file opened in Excel.
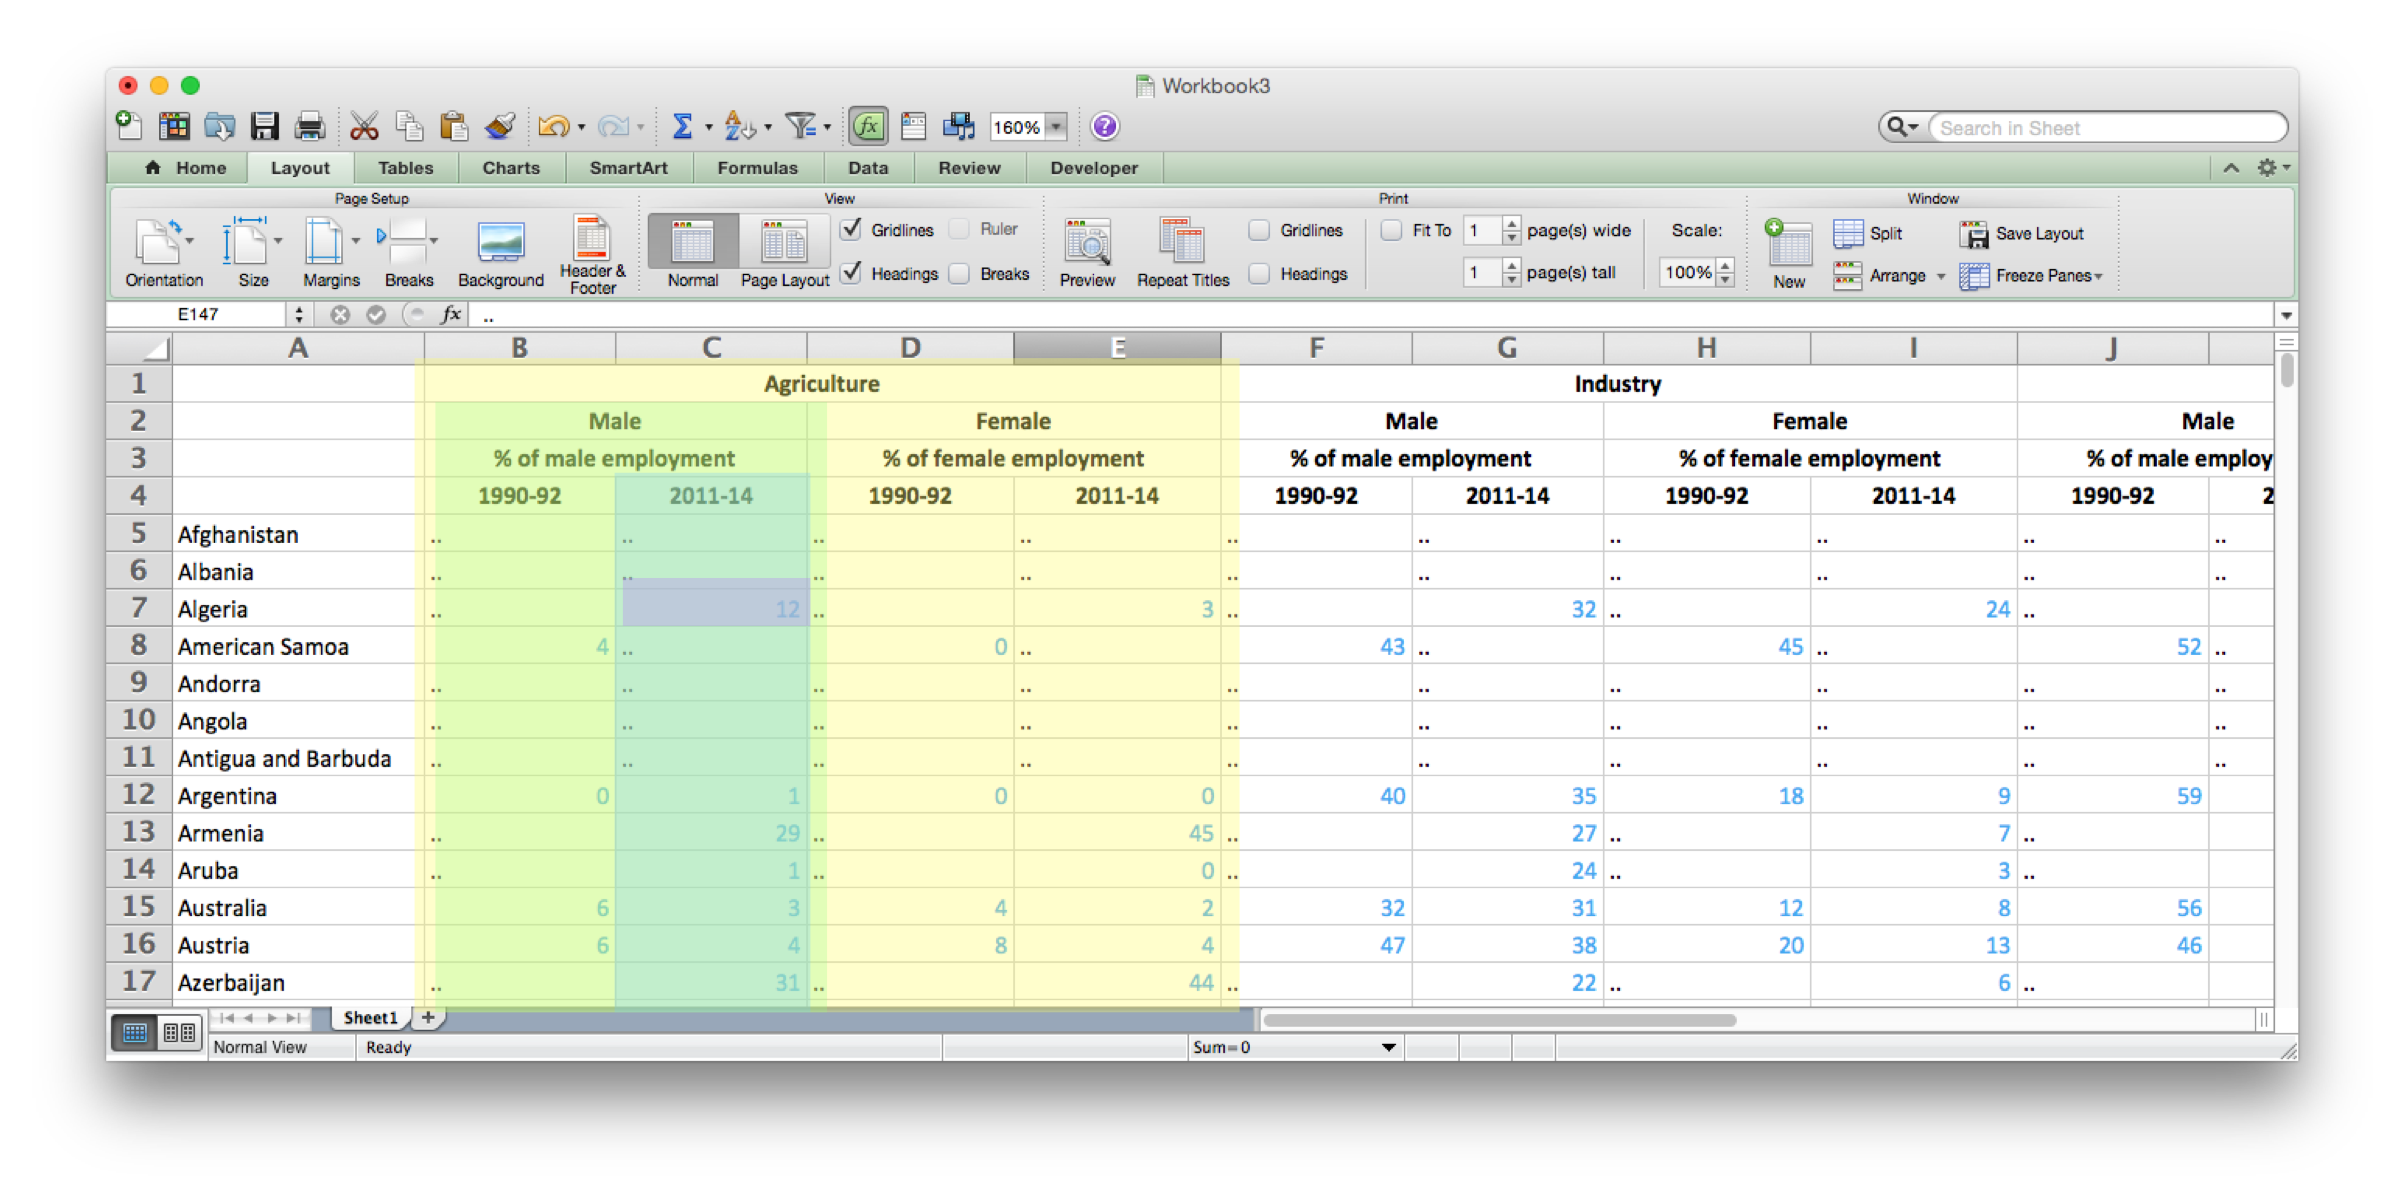
The key thing to realize is that each field below the headers and to the right of the first column will end up as a separate row in our output. For example the purple field holds the value 12 and will translate to:
country,sector,gender,period,employment_percent
Afghanistan,Agriculture,Male,2011-14,12
The colored boxes show how we can understand the meaning of the headers to fill out the country,sector,gender and period columns. For example we can see the outer yellow box shows the the first four columns are about the “Agriculture” Industry. So each field below the headers will have “Agriculture” as the value under our new “sector” header. Similarly the light green box shows that each of the fields in the green columns will have “Male” as the value for our new “gender” header. And the darker green box shows the fields that will have the value 2011-14 in the period column. We can see this, but it is hard to make the computer understand this.
To make this easier for the computer we’re going to make the headers repeat in each column. We’ll do this in python but to understand better I’ll show it in Excel first. In Excel the way that one makes a column visually apply to lots of fields below it is to merge the cells, then center the label in the cell. We can undo this using the “Unmerge Cells” function (note that I’m just doing this in Excel to illustrate, saving as a csv does this automatically.)

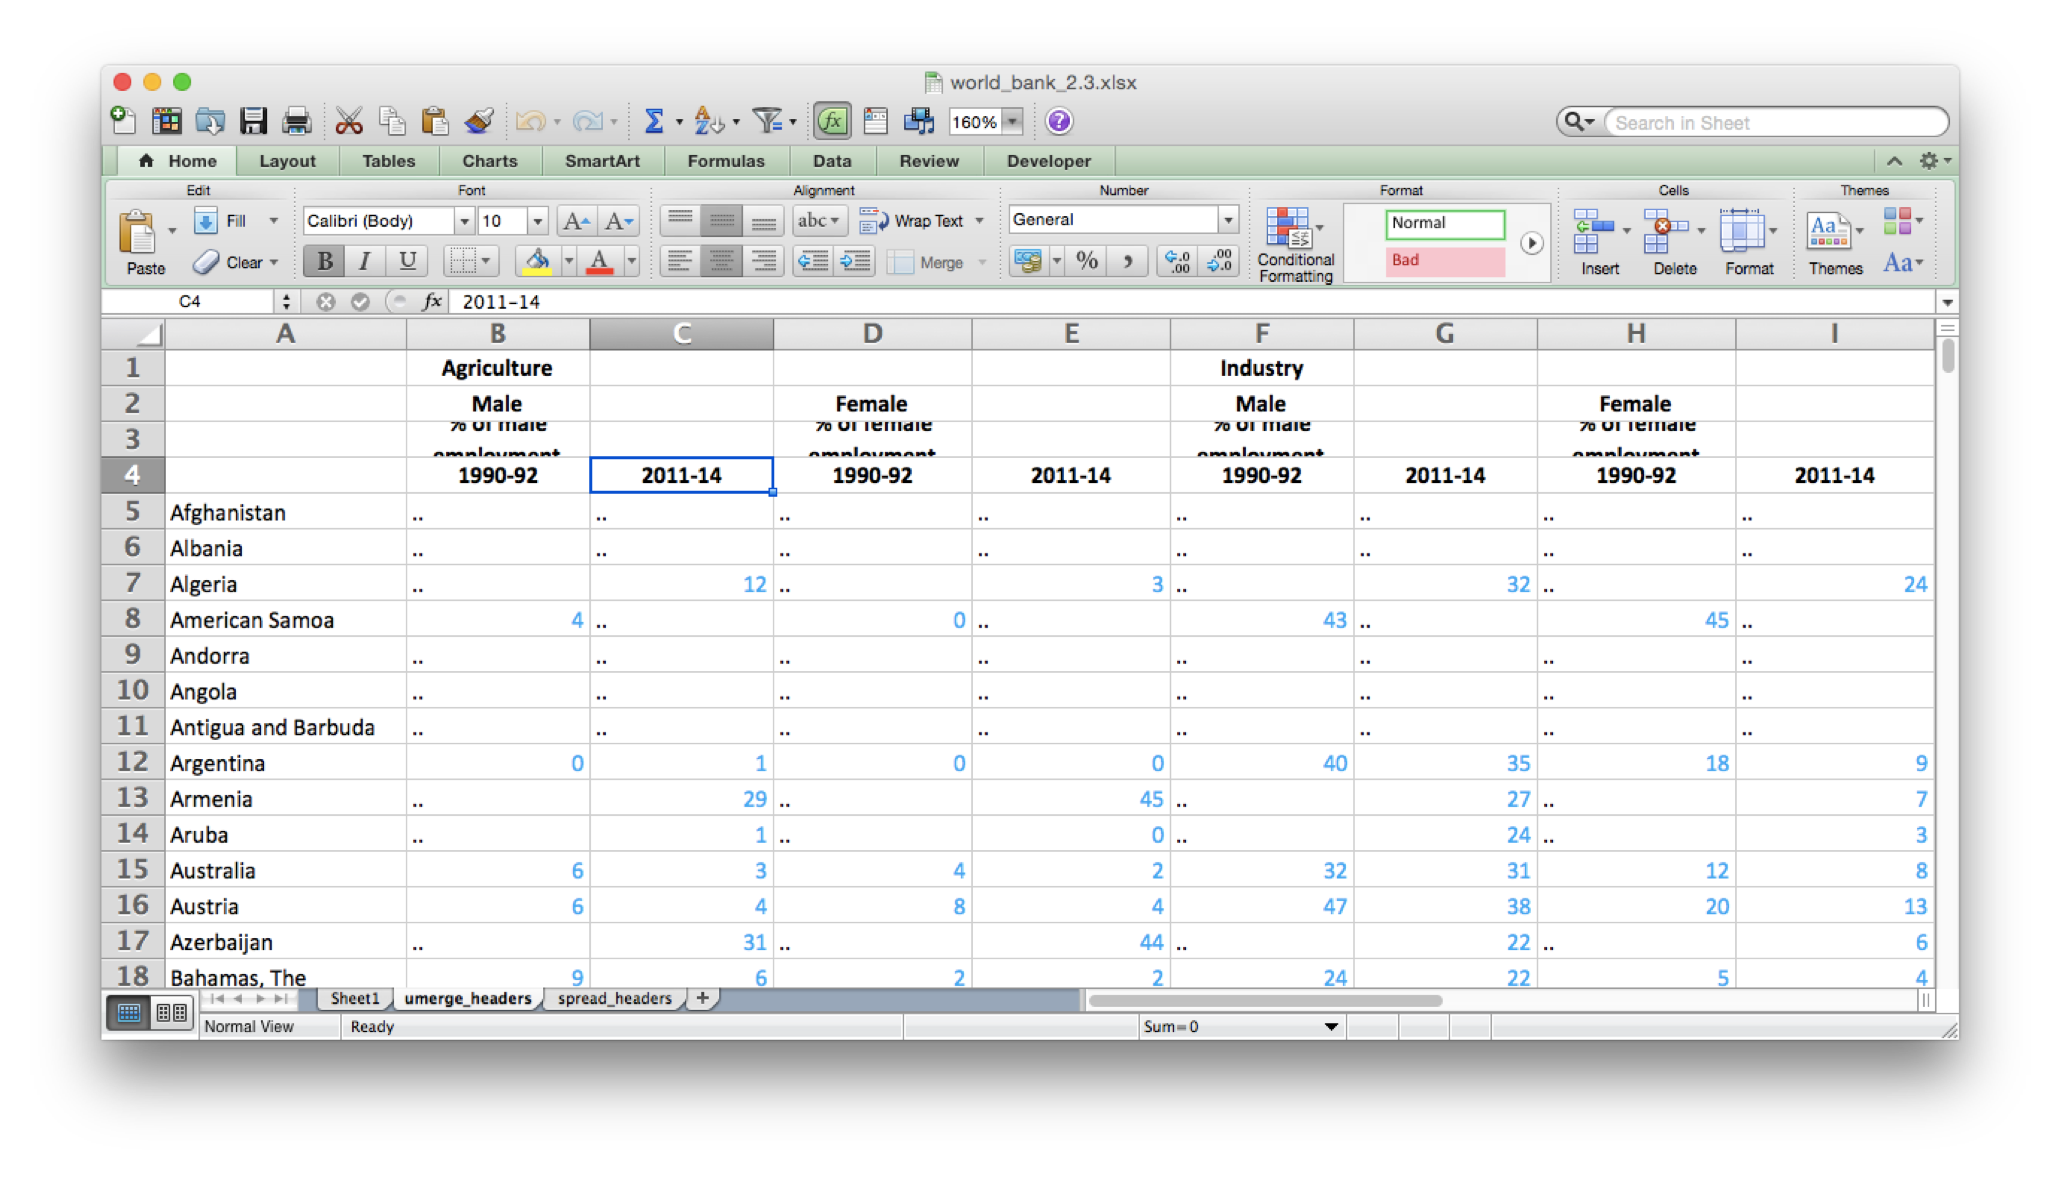
Figure 3 shows that when we do this on Agriculture the merged call reverts to the four original cells and the “Agriculture” label moves into the left-most of those four cells (column B). (The “% of Male Employment” header in row 3 is too long for the width of the columns and so displays strangely.) Now for the data values in column B we can find the value of the sector column in our output data by looking at the value in cell B1. For Column B we can also find the relevant values for gender (B2, “Male”) and period (B4, “1990-92”). This also works for column F where the sector is “Industry”, gender is “Male”, and period is “1990-92”. However in other columns this doesn’t work, such as column C where all the gender and sector rows are empty. The reason this happens is that unmerge only put the value into the left-most cell, but we need the value put into all the cells that were merged. I did that manually in above (and will show how to do it in python below).
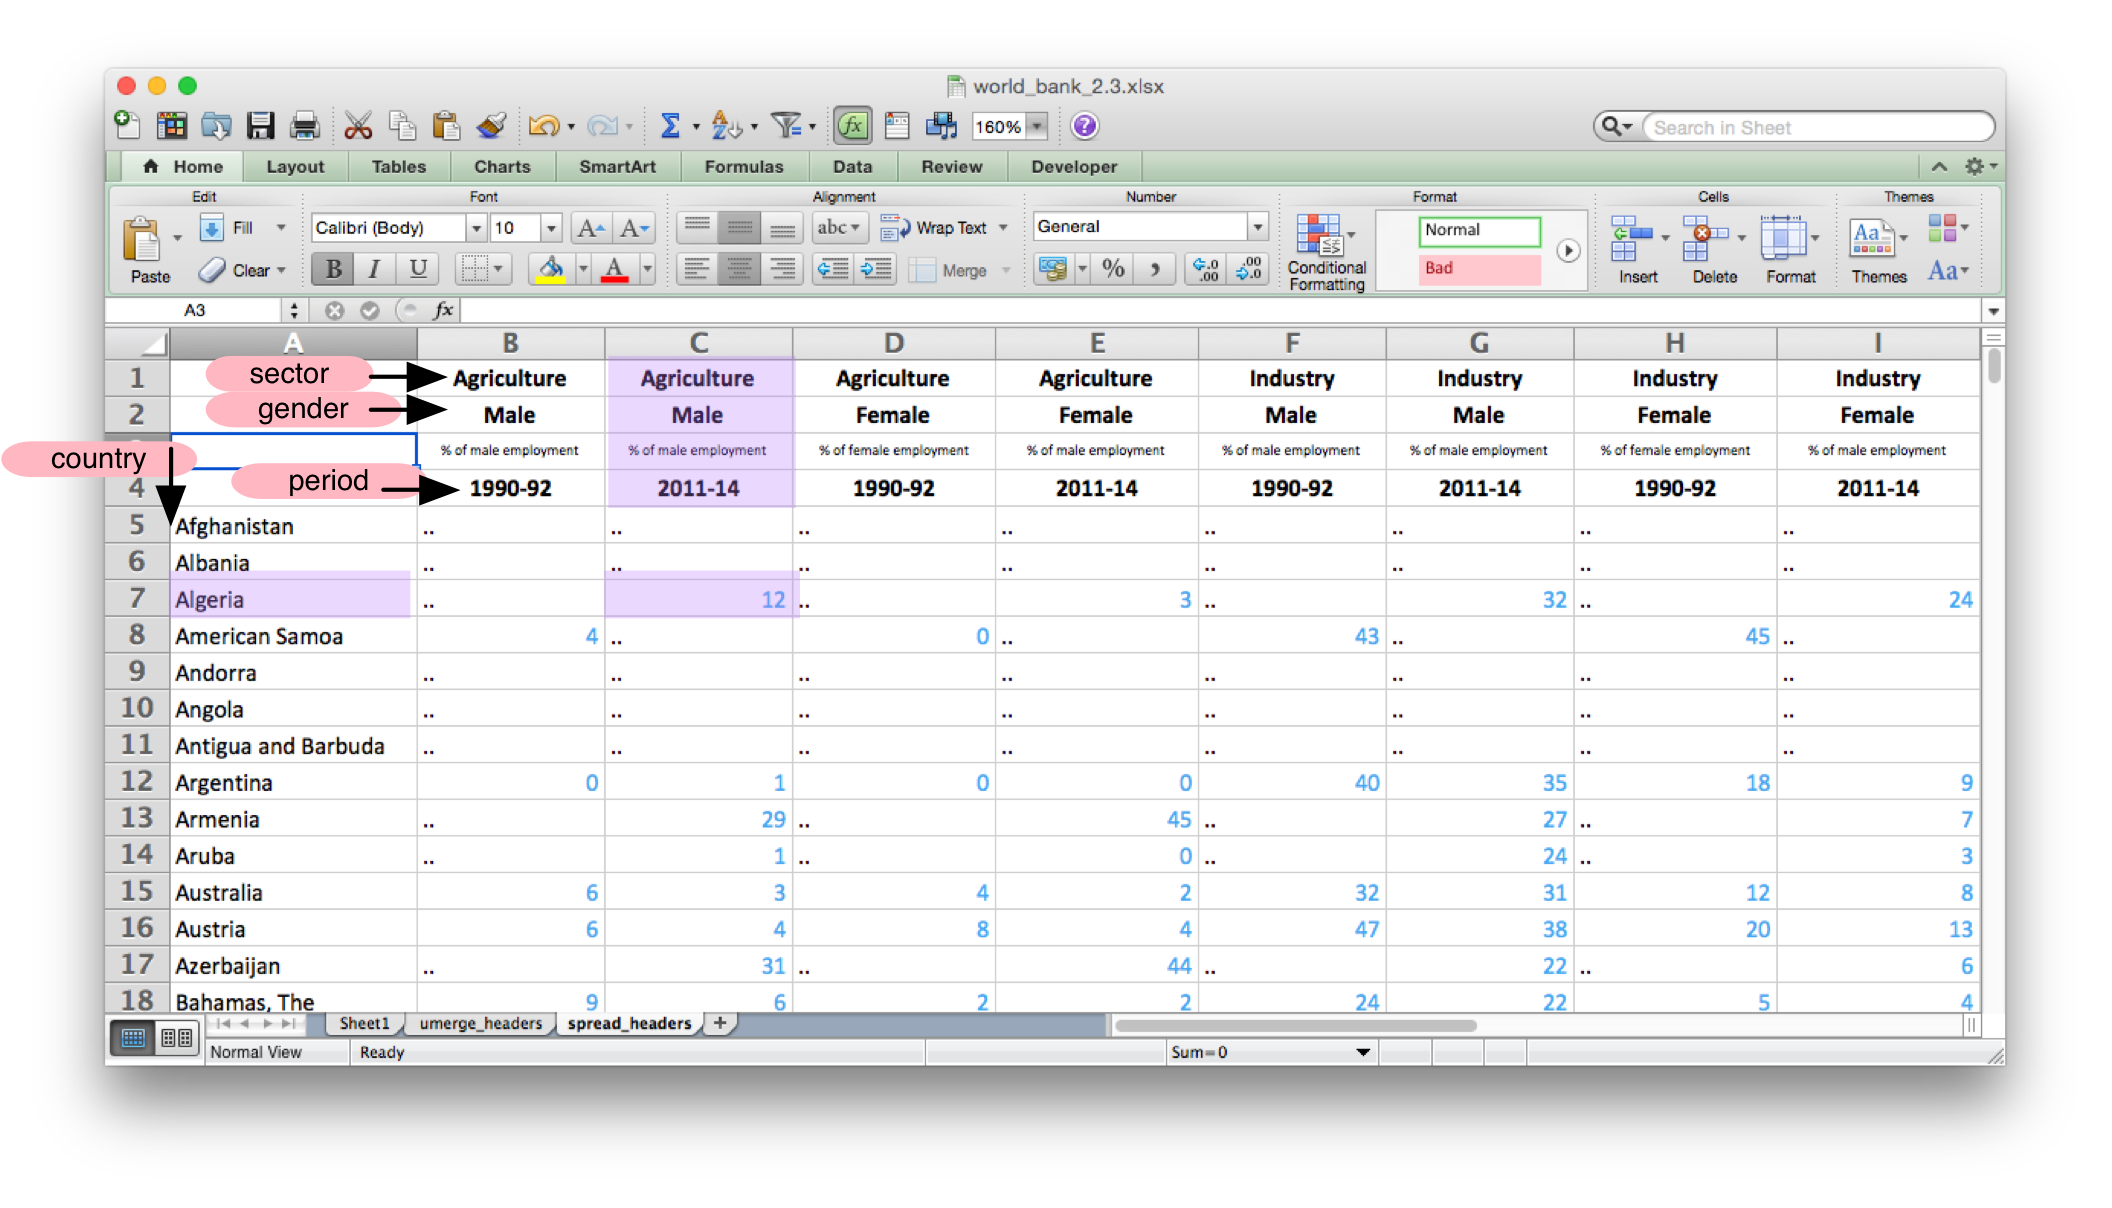
Now, for any cell, we can find the values for the four other columns of our output. The country will be in the first column of the row, the sector will be in the first row of the column, the gender will be in the second row of the column, and the period will be in the fourth row. We don’t end up using the third row of the column at all.
The nice thing about this process is that it will work for any multiple headers that use merged cells (and a similar process would work for values intended to apply to multiple rows).
To apply this in python we first need to save the Excel sheet as a CSV. Doing that removes the merged cell, just as if we’d used the Unmerge function above. Once we have the csv file, we need to read it in python CSV. Because we don’t have useful column names (yet!) we will read the CSV with a regular reader (which returns a list for each row rather than a dictionary).
with open('world_bank_2.3.csv') as csvfile:

  # Must use csv.reader to get each row as a list.
  myCSVReader = csv.reader(csvfile, delimiter=",", quotechar='"')
Before we can move through row by row using a for function, we have to get the headers. We can do this using the next() function that python provides. That accesses the next row in the csv, removing it from the rows left to process meaning that we won’t see those rows again when we iterate through the data rows using a for function.
sectors = next(myCSVReader) # first row is sectors, Agriculture etc.
genders = next(myCSVReader) # genders, Male and Female
unused = next(myCSVReader) # "% of male employment"
periods = next(myCSVReader) # periods, e.g., 1990-94
If we print these, though, we see that they only have a value for the leftmost cell of each group, as in Figure 4, above. So we have to spread the values across the rows so we can access them later using the index (or column number) when looking at a specific data point. For that we’ll use a function called “spread_list”:
sectors = spread_list(sectors)
genders = spread_list(genders)
periods = spread_list(periods)
We can see that afterwards the sections, genders, and periods lists have values in each of the previously blank positions. They don’t have a value in the first spot because that lines up with the country position in the data rows.
The code in spread_list is nothing too special, although we haven’t talked much about functions. We can define a function when we have little bits of code that we are going to reuse. Here the function takes a list (called inlist inside the function) and returns a list (called outlist in the function). The code goes through the inlist, moving left to right. If the item is empty then it is filled with the last item that wasn’t empty, and the result added to the outlist.
"""
Function to spread list values left to right.
Used to deal with implicit multiple headers.
["","value","","value2",""] ==> ["","value","value","value2","value2"]
"""
def spread_list(inlist):
    outlist = []
    curr = ""
    for item in inlist:
        if(item): # hit a new one, update
            curr = item
        outlist.append(curr) # append old or new item
    return outlist
Now we have lists in which we can look up values. e.g., the value of sector[5] is “Industry” so when we’re processing values in the sixth column we can grab the appropriate value of sector.
With that prep out of the way, we can now move through the rest of the data rows, using the familiar for function. First, though, we create an empty list called outrows that we’re going to add out newly structured rows to. We don’t strictly speaking have to do that, we could write the rows directly into a csv or push them straight into a database, but it makes the code a bit simpler to first store them all then choose how we want to output them.
outrows = [] # gather output rows into a list.

for row in myCSVReader:
  print(row)
We can see that each row is a list. The first item (row[0]) is the country, and everything after that is a value field (either a number or the missing data string ".."). We want to move through the row left to right, note the country, and then make a new outrow for each of the value fields. Normally we would just iterate through the row list, using:
for row in myCSVReader:
  for item in row:
    print(item)
But this time we also need the index (or position) for each item, so we can find the corresponding spot in the sectors, genders, and periods lists. Python has a way of getting both the values in a list and their position at the same time, called enumerate.
for row in myCSVReader:
  for index,observation in enumerate(row):
    print("At index {} we found {}".format(index,observation))
We need to do something special, though, for the first item (index 0) because that contains the country. We’ll then reuse that value for all the other fields in the row.
for row in myCSVReader:
  for index,item in enumerate(row):
    if (index == 0):
      country = item
    else:
      # process rest of values, creating the outrows.
So now we can finally put our outrow together. We have the country and the observation and we have the index to look up the gender, sector, and period. Having created the outrow we add it to our overall list that we’re building up (called outrows) using the list.append function. Using sectors[index] is just like looking at the Excel sheet and look up to the sectors header row to find the relevant sector.
outrow = {  "country": country,
            "sector": sectors[index],
            "gender": genders[index],
            "period": periods[index],
            "employment_percent": item }

outrows.append(outrow)
Finally, in a wrinkle unrelated to multiple headers this csv uses “..” for missing values. We can either choose to skip these or change them to “NA”.
if (item == ".."):
  item = "NA"
So, putting that all together we have:
for row in myCSVReader:
  for index,item in enumerate(row):
    if (index == 0):
      country = item
    else: # everything after the first column
      # process rest of values, creating the outrows.
      if (item == ".."):
        item = "NA"

      outrow = {  "country": country,
                  "sector": sectors[index],
                  "gender": genders[index],
                  "period": periods[index],
                  "employment_percent": item }

      outrows.append(outrow)
Huzzah, now we have a list of dicts in our new structure, ready to output or to insert into the database. Outputting the list of dicts as a csv uses the same code that we’ve used before.
out_headers = ["country","sector","gender","period","employment_percent"]

with open('outWorldBank.csv', 'w', newline='') as csvfile:
    myCsvWriter = csv.DictWriter(csvfile, delimiter=',', quotechar='"',
        fieldnames = out_headers)

    myCsvWriter.writeheader()

    for row_dict in outrows:
        myCsvWriter.writerow(row_dict)
Or we could insert this into a table in mysql using code we’ve used before, assuming we have a database connection and a cursor.
sql_placeholder = """
  INSERT INTO
   world_bank_data(country,
                   sector,
                   gender,
                   period,
                   employment_percent)
    VALUE (%(country)s,
           %(sector)s,
           %(gender)s,
           %(period)s,
           %(employment_percent)s)
"""
for row_dict in outrows:
  cursor.execute(sql_placeholder,row_dict)
Here’s the full code (which is also in data_wrangling_class_files/7_csv/7_1_reading_csv)
import pprint
import csv

##################
# Some csv files have multiple header rows.
# A good example is files from the World Bank:
# http://wdi.worldbank.org/table/2.3
# which has 4 lines of headers.
##################

# World bank file has 4 rows of headers:
# ,Agriculture,,,,Industry,,,,Services,,,
# ,Male,,Female,,Male,,Female,,Male,,Female,
# ,% of male employment,,% of female employment,,% of male employment,,% of female employment,,% of male employment,,% of female employment,
# ,1990-92,2011-14,1990-92,2011-14,1990-92,2011-14,1990-92,2011-14,1990-92,2011-14,1990-92,2011-14

# Data looks like:  Note .. means no data.
# Afghanistan,..,..,..,..,..,..,..,..,..,..,..,..
# Albania,..,..,..,..,..,..,..,..,..,..,..,..
# Algeria,..,12,..,3,..,32,..,24,..,56,..,73
# American Samoa,4,..,0,..,43,..,45,..,52,..,25,..

# output should look like:
# country,sector,gender,period,employment_percent
# American Samoa,Agriculture,Male,1990-92,4
# Algeria,Agriculture,Female,1990-92,12

# Also data ends on first completely empty line.

"""
Function to spread list values left to right.
Used to deal with implict multiple headers.
["","value","","value2",""] ==> ["","value","value","value2","value2"]
"""
def spread_list(inlist):
    outlist = []
    curr = ""
    for item in inlist:
        if(item): # hit a new one, update
            curr = item
        outlist.append(curr) # append old or new item
    return outlist

with open('world_bank_2.3.csv') as csvfile:

  # Must use csv.reader to get each row as a list.
  myCSVReader = csv.reader(csvfile, delimiter=",", quotechar='"')

  # Deal with multiple headers. next(myCSVReader) gets a row
  # From the file. It's similar to what happens in the for loop
  # but just gets one row. The spread_list function
  sectors = spread_list(next(myCSVReader)) # first row is sectors
  genders = spread_list(next(myCSVReader)) # second row is genders
  unused = spread_list(next(myCSVReader)) # "% of male employment"
  periods = spread_list(next(myCSVReader)) # periods.

  outrows = [] # gather output rows into a list.

  for row in myCSVReader: # remaining rows
    #pprint.pprint(row)
    # The file has a bunch of documentation below so we use the blank
    # line before the documentation to signal end. any(row) checks
    # whether any of the values in row are not blank.
    # https://docs.python.org/3/library/functions.html#any
    if (not any(row)):
        break # if hit row without data, we're done, break out of loop
    else:  # data rows start
        for row in myCSVReader:
          for index,item in enumerate(row):
            if (index == 0):
              country = item
            else: # everything after the first column
              # process rest of values, creating the outrows.
              if (item == ".."):
                # continue # could skip or make it NA
                item = "NA"

              outrow = {  "country": country,
                          "sector": sectors[index],
                          "gender": genders[index],
                          "period": periods[index],
                          "employment_percent": item }

              outrows.append(outrow)


out_headers = ["country","sector","gender","period","employment_percent"]

with open('outWorldBank.csv', 'w', newline='') as csvfile:
    myCsvWriter = csv.DictWriter(csvfile, delimiter=',', quotechar='"',
        fieldnames = out_headers)

    myCsvWriter.writeheader()

    for row_dict in outrows:
        myCsvWriter.writerow(row_dict)
A tidyverse solution
I also love the tidyverse approach in R, but had a little difficulty using it with these multiple header files. Here’s one shot at it, with suggestions from jennybc at tidyverse github
library(tidyverse)
library(readxl)

filename = "2.3_Employment_by_sector.xls"

download.file("http://wdi.worldbank.org/AjaxDownload/FileDownloadHandler.ashx?filename=2.3_Employment_by_sector.xls&filetype=excel",destfile=filename)

# There is something odd with this file, I need to open it
# and save the file from Excel, giving it another title.

headers <- read_excel(filename, col_names = FALSE, na="..", n_max = 4)
# 12 columns. Add country later.

# fill only works down or up, so have to transpose headers
long_headers = data.frame(t(headers))
# Add column names down the columns
long_headers <- fill(long_headers,1:4) # all four columns
headers <- data.frame(t(long_headers)) # back to vertical.

# summarize using str_c from stringr which collapses strings.
# summarize_all makes it work on all columns.
column_labels <- headers %>% summarize_all(str_c, collapse = "--")

# pull them into one character vector, add country.
headers = c("country", unname(unlist(column_labels[1,])))

# use headers on reading rest of file.
world_bank <- read_excel(filename, col_names = headers, na="..", skip = 5)
# Now the file is a wide format file, with the multiple headers
# all in one header. e.g., "Agriculture--Male--% of male employment--1990-92"

# We use dplyr gather to convert to long format, creating a
# "variable" column for the value of the merged
# header.  ie we move "Agriculture--Male--% of male employment--1990-92" from the column header into the value of the variable column.
# We then use separate to move that into multiple columns.
# country,industry,gender,extra,period,employment_percent
# Afghanistan,Agriculture,Male,% of male employment,1990-92,<NA>
# We drop extra and convert employment_percent to numeric.

world_bank_long <- world_bank %>%
 gather(variable, employment_percent, -country) %>%
 separate(variable, c("industry","gender","extra","period"),sep="--",remove=TRUE) %>%
 select(-extra) %>%
 mutate(employment_percent = as.numeric(employment_percent))